Good Integration
Peak integration
Peak integration is used for area calculation, identifying and setting method retention times which can then be used to name peaks. This is essential for determining the presence and concentration of the target compounds. Reference standards should be used to identify the RT and subsequent peak names.
Integrating peaks in CompassCDS can be done manually or automatically. With automatic integration we can get the desired integration of the peaks by optimizing peak width and threshold but other parameters may need to be considered.
The most crucial element of integration in order to obtain reliable results is consistency.
The peak width defines the width of the peaks in the chromatogram for them to be identified. It determines the beginning and the end of a peak which is used to detect the desired peaks in the method. This ensures accurate and consistent integration of the peak area.
The threshold is used to separate baseline noise and peaks. It sets the minimum signal level that a peak should have to be identified as a valid peak. This helps to avoid false positives and ensures that only relevant peaks are integrated.
The start and end time of the integration is crucial. It inhibits integration of the solvent peak or any other contamination peaks that are visible before or after the analytes.
Basic steps to follow before integrating chromatograms
Check if the chromatogram is as expected to allow the peaks to be processed by looking at :
• The peak shape, look for tailing or fronting.
• The separation, check if peaks are separated correctly or if there is coelution.
• The noise, see if your baseline is stable.
• The contamination, check if there are extra peaks (or spikes) visible in the chromatogram.
How to integrate a peak in CompassCDS
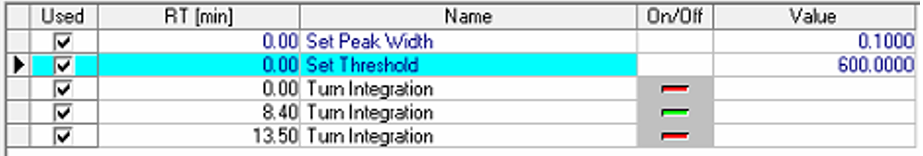
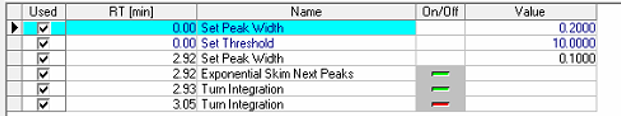
Open the chromatogram → on the left, click method → below, click on integration events. Here the peak width and threshold can be adapted.
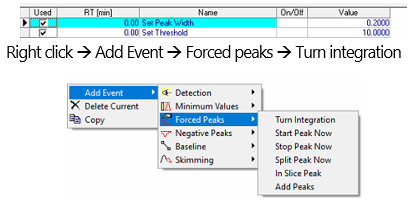
Add a start retention time → e.g. 8.4 min → repeat Turn integration to add an end retention time → e.g. 13.5 min. To start integration make the On/Off colour green, and to stop make it red.
Click the below icon to integrate the chromatogram (Figure 1).
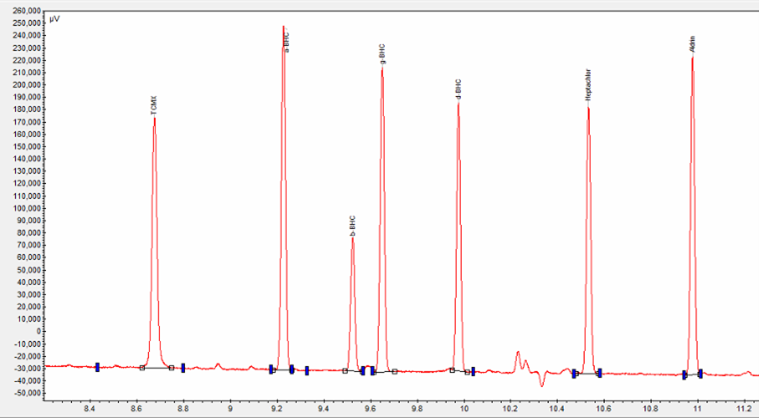
Figure 1 Integrated chromatogram
Name the peaks with CompassCDS
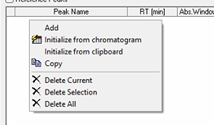
Open the chromatogram → on the left, click on method → click on peak identification.
![]()
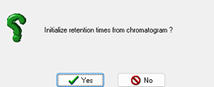
Right click → Click initialize from chromatogram
Click on Yes →
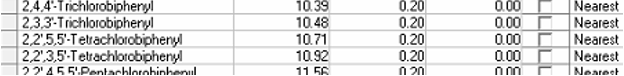
Now visible is a column of unknowns →

![]()
Click on this icon to integrate to double check if all wanted peaks in the chromatogram are integrated correctly and then name the peaks →
Click on this icon to integrate so the correct peak names appear on the chromatogram.
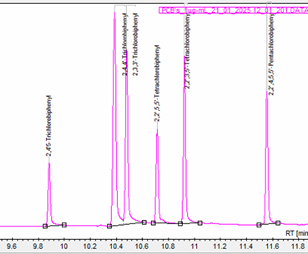
Figure 2 Peak names
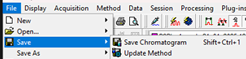
Click on file → Save → Update method
Now the method is updated and every new injection with this method will have the peaks already integrated and named (Figure 2).
Base to base integration
It is important to adjust the integration parameters to ensure reliable and accurate results. Each chromatogram and peak may need different integration depending on peak characteristics. The most common integration which is used in chromatography is base to base integration.
Base to base integration integrates the peaks from the baseline, from the start to the end of the peak (Figure 3).

Figure 3 Base to Base peaks
Valley to valley integration
Valley to valley integration is used in particular when peaks are not well separated and overlap with one another.
Integration is done by drawing a baseline from the lowest point (valley) between the two peaks to the next valley. This separates the peaks (Figure 4).
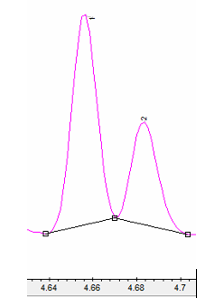
Figure 4 Valley to Valley peaks
Exponential integration
Exponential integration, this technique is particularly used when the peaks are overlapping and tailing.
It helps to separate a small peak from a larger (main peak) by creating a curvature (Figure 5).
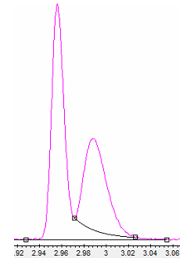
Figure 5 Exponential peaks
Tangential integration
Tangential integration often refers to tangential skim and is used when peaks are overlapping and not separated at the baseline.
It separates a small peak from a larger main peak (Figure 6).
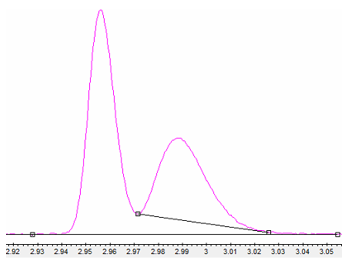
Figure 6 Tangential peaks
Peaks with tailing or fronting
Peak asymmetry can be caused by several factors. This leads to peaks that tail, front or show other irregular peak shapes.
This can be caused by several things such as:
• Column issues and column contamination. Ensuring the column is maintained properly and replaced when needed will help to avoid these peak issues.
• Injecting too much sample. Ensuring that the sample volume is optimized is important to avoid overloading the column.
• Incorrect column flow rates. It is important that the flow rate is in the optimal range for the application.
• Detector issues. Contamination or incorrect settings for detectors can cause asymmetrical peaks. Regular maintenance is suggested to avoid these issues.
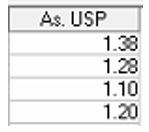
In CompassCDS, there is an option to add ‘Asymmetry AS. USP’ to the results table (USP; United States Pharmacopeia). This calculates if the peaks in the chromatograms are asymmetric.
Generally between 0.5 -1.5 As. USP is an acceptable variance but can be dependent on different regulations determined by the application.
1 As. USP = Perfect peak
<1 As. USP = Fronting
>1 As. USP =Tailing
Summary
Using SCION Instruments CompassCDS software, integrating peaks can be easily done in several ways. Choosing the correct integration method is dependent on your application and regulations for your analysis. Always check the results of your analysis are within your specification before re-integrating the chromatogram. The most crucial element of integration in order to obtain reliable results is consistency.