GC-MS Tune Report
Automatic tuning of a GC-MS is essential for ensuring accurate and reliable results. It involves optimizing various instrument parameters to achieve optimal sensitivity, resolution and mass accuracy. A properly tuned GC-MS system provides confidence that the instrument is performing as expected, which allows for accurate analysis and interpretation of results. An example tune report from MSWS is displayed below (Figure 1). 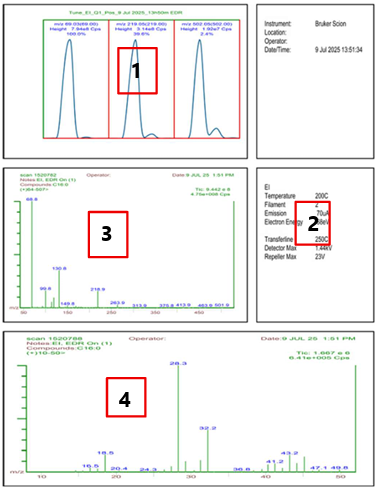
Figure 1 Tune Report
Segment 1
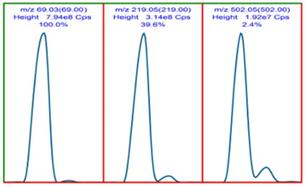
Figure 2 Three peaks
This section shows the signal of the three main fragment ions from the PFTBA tune mixture (Figure 2).
Criteria:
- Confirm that the instrument has selected the correct masses, normally 69 (100%), 219 (20-75%), 502 (1-15%).
- Ensure that the intensity of the signal is high enough. The mass response of ion 69 should typically be between 107 and 108. In this example the mass response is 7.948, which is within specification.
- Confirm that the peak shapes are gaussian and symmetrical. The bumps after each peak is normal. If the peaks have bumps before the peak like in Figure 3, it can indicate that the source should be cleaned.
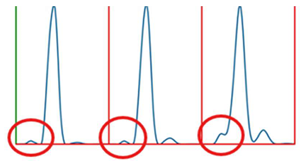
Figure 3 Contaminated peaks
- Check if the baseline is stable and that there is no unusual noise present.
Segment 2
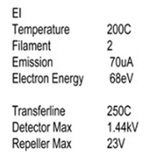
Figure 4 Settings instrument
This section shows the settings of the instrument used to obtain the tune data (Figure 4).
Criteria:
- The multiplier voltage (Detector Max) will drift upwards over time. This depends on instrument usage and how often the detector is tuned
1. 1.00 – 1.39 kV, ideal value
2. 1.40 -1.69 kV, consider cleaning or replacing multiplier.
3. 1.70 – 2.00 kV, replace multiplier - The Repeller Max should typically be between 20-25 V.
Segment 3
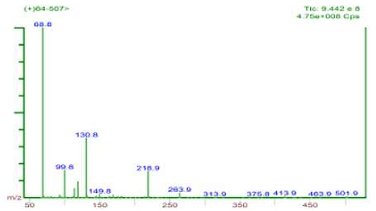
Figure 5 Scanned peaks
This section (Figure 5) gives more information about the peaks produced from the tune. In this spectrum, you can clearly see that peak 69 is the most abundant mass, 219 comes next and although at a much smaller ratio mass 502 is visible. Mass 130 is not used in the tune report but is also a large peak attributed to the PFTBA tune mixture.
Criteria:
- Visually check that the correct masses have been detected.
- Check that the target masses 69, 219 and 502 have been correctly selected by the instrument.
- Unusual signals in the spectrum can indicate contamination and could means that the source requires cleaning.
- Verify that the baseline noise is minimal.
Segment 4
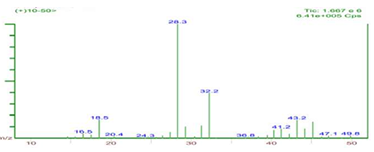
Figure 6 Air/water
This section checks the masses between 10 and 50 (Figure 6). To ensure that the air/water peaks are within specification and that there are no leaks present on the instrument. Mass 18 is water, mass 28 is nitrogen and mass 32 is oxygen.
Criteria:
- Verify that the signal for all of these ions is below 9.07.
- A high signal from mass 18 (water) can indicate contamination from water present in the GC-MS (after cleaning) or an exhausted moisture filter
- The most common place for leaks is the ferrule connection between the column and the transferline. This should contain a graphite(15%)/vespel(85%) ferrule and may need tightening.
Different Tune Settings
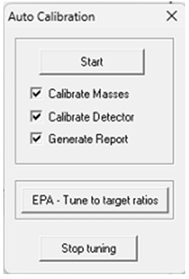
Figure 7 Calibration options
When you are starting a tune there are several options to choose from, shown in Figure 7. This can be adjusted to your own preferences
- Generate report (Tune Check)
This can be executed daily as will not alter your system and will only ensure the health of your system against the last tune.
2. Calibrate masses
It will tune the masses, lenses, repeller, etc. It should be performed fairly frequently, especially after changing the column or cleaning the source.
3. Calibrate detector
This will tune the detector multiplier. During this tune the detector max will rise which is why this tune is required much less frequently. This tune should be done only monthly or even less.
Conclusion
A regular tuning schedule is essential for optimal system performance and helping to prevent unnecessary instrument downtime.