S-SL Liner Guide
Choosing the correct liner is crucial because it facilitates the transfer of the sample to the GC column. It can significantly influence the accuracy of the analysis. At SCION Instruments, we have various different liner types available;
SCION Instruments liners
- Manufactured with the highest quality glass/quartz wool for minimal degradation, elimination of active sites and optimised volatilization.
- Are designed with specific geometries for applications for sample introduction optimization.
- Ultra inert liners prevent breakdown of active compounds.
- Ultra inert liners optimize peak symmetry in ‘hot injections’.
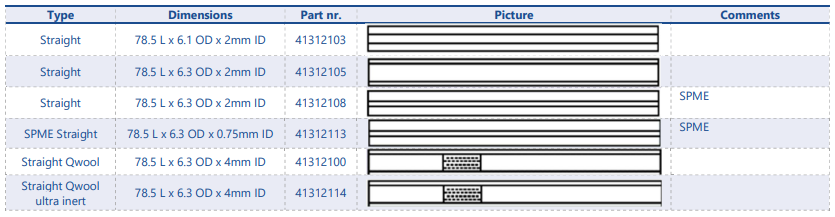
Straight liner
- General purpose analysis
- Can be used with concentrated and dirty samples, if quartz wool is inserted
- Gaseous samples can be analyzed using this liner, also with purge and trap and headspace
- Promotes higher split flows
- Most suitable for packed columns
- Low cost liners
- Low risk of thermal decomposition
- Optional: quartz wool – helps with evaporation, mixing of analytes, trap non-volatile materials and limit discrimination
- Best used for low boiling compounds
- 0.75, 2 or 4 mm ID
- 4 mm ID for larger sample volumes (ideal for splitless injections)
Gooseneck liners
- Good for use in trace level analysis and analysis of active compounds
- Eliminates any dead volume – perfect for packed columns
- Minimize breakdown of active compounds
- Improves efficiency of direct injection
- Regarded as the best split/splitless liner
Gooseneck with wool liners
Additional Benefits:
- Packed with quartz/glass wool
- Minimize discrimination
- Trapping of non-volatile components
- Mixing of analytes
- Risk; overtime wool can become adsorptive

Recessed Gooseneck
Additional benefits:
- Can be packed with glass wool at the top – trap non-active compounds, mixing of analytes
- Dual column analysis
- Reduced active sites, meaning no unwanted reactions would take place in sample
- Great recovery and linearity for trace analysis of active compounds
- Addition of quartz wool – help in evaporation, trap non-volatile materials (dirty samples) and limit discrimination

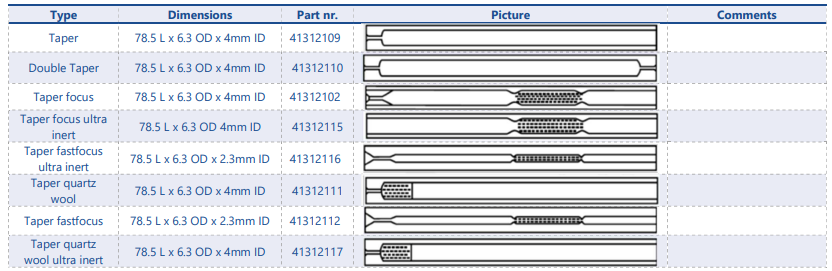
Focus liner
- Keep the quartz wool in place
- Minimize discrimination of high molecular weight compounds
- Improved vaporization of the sample
- Excellent reproducibility
- Prevention of droplet formation
- General purpose
- Concentrated samples
- Dirty samples
Tapered (focus) liner
- Trace level analysis
- Dirty samples
- Analysis of wide boiling point range compounds
- Bottom taper – focuses the sample at the entrance of the column
- Keep the quartz wool in place (if the quartz wool is used)
- Excellent reproducibility
- Prevention of droplet formation
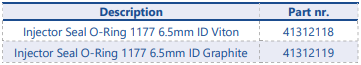
O-rings for liners
SCION injector o-rings provide leak tight seals. It is recommended to replace the o-ring whenever the inlet is untightened (E.g. to check liner condition) They are available in Graphite or Viton depending on the temperature of the injector. For high temperature injectors, use Graphite (max 450°C).
Download this technical note- S-SL liner guide v1