The Analysis of Electronic Cigarette E-Liquid Ingredients by GC-MS
Introduction
There are over 35 million electronic cigarette users worldwide with the global vapour product market at over £17 billion pounds[1]. Although they are widely used, there is limited characterisation of the composition of e-liquid ingredients used during vaping. As vaping becomes an increasing trend, regulations are being introduced for electronic cigarettes and e-liquid manufacturers worldwide. The Tobacco Products Directive 2014/14/EU has recently introduced a limited guideline on the manufacturing of e-liquids[2]. These guidelines are more focused on the concentration of nicotine, caffeine, taurine and colourings rather than flavourings and impurities. Although there are labelling requirements in place, there is no current regulation on a comprehensive list of ingredients; the majority of e-liquids only define propylene glycol, vegetable glycerin and nicotine as ingredients.
SCION Instruments developed a method for the quick and easy compositional analysis of e-liquid ingredients by gas chromatography with mass spectrometry. Along with the vendor listed compounds, various flavour compounds and impurities were identified.
Experimental
A SCION 436 GC was coupled with the SCION Single Quad Mass Spectrometer (SQ MS) and 8400 Autosampler. Mass Spec Work Station software was used for instrument control, data acquisition, data processing and spectral library comparisons. Four commercially available e-liquids were purchased and analysed both neat and a 1 in 2 dilution (in methanol). Table 1 details the analytical conditions of the GC-MS system.
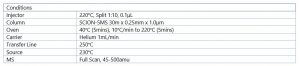
Table 1. Analytical conditions of GC-MS
The four flavours of e-liquid were bubble-gum, pear drop, cherry tree and blueberry. The nicotine content of the bubble-gum, pear drop and cherry tree was 6mg with the blueberry e-liquid containing 3mg of nicotine.
Pure nicotine was used to prepare a calibration curve for the quantification of nicotine in all e-liquids. The calibration standards prepared were at 0.5, 1,3,5 and 10mg.
e-Liquid Testing Results
Initially, all e-liquid samples were injected neat. Figure 1 shows the chromatogram obtained for the bubble-gum e-liquid. The remaining samples also gave a similar chromatogram, in regard to propylene glycol, vegetable glycerin and nicotine.
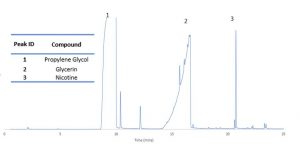
Figure 1. Neat injection of bubble-gum flavoured e-liquid
As shown in Figure 1, the propylene glycol, glycerin and nicotine were the three main compounds in the chromatogram. These were the only ingredients listed on all four samples and were confirmed by a NIST spectral library match. Propylene glycol and glycerin were overloaded, due to the amount they constitute in the matrix of all samples, and therefore result in poor chromatography. Due to the overloading of the glycerin in particular, there are other potential compounds that are being masked. To overcome this issue, all samples were diluted in methanol (1in2) and a scan segment based full scan method was utilised. The original full scan method was adjusted in mass spec work station as follows. A whole scan range from 0.5-28 minutes remained the same whilst three individual scan segments were added; 0.5-8 minutes, 9.75-14 minutes and 18-28 minutes. Additionally, during the middle two scan segments the first masses were increased to 80 and 77 respectively.
Figure 2 shows the scan segment acquisition method. The graph is automatically generated in the software.
The orange bar shows the scan segment used to reduce the intensity of the propylene glycol whereas the dark green bar shows the scan segment used to eliminate the glycerin, allowing previously masked peaks to be detected.
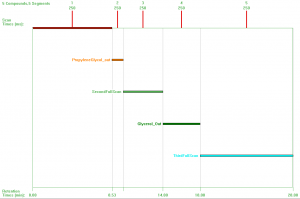
Figure 2. Scan segments of the full scan method utilised in mass spec work station.
All diluted e-liquid samples were then analysed using the scan segment method. Figures 3a-3d show the chromatogram from each e-liquid.
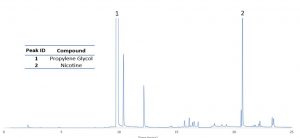
Figure 3a. Injection of the diluted bubble-gum flavoured e-liquid
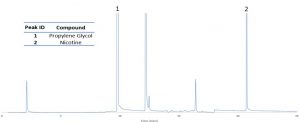
Figure 3b. Injection of the diluted pear drop flavoured e-liquid
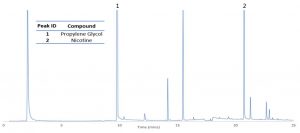
Figure 3c. Injection of the diluted cherry-tree flavoured e-liquid
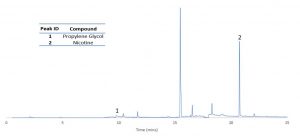
Figure 3d. Injection of the diluted blueberry flavoured e-liquid
As shown in Figures 3a-3d, the chromatography vastly improved by diluting the sample and running a scan segment acquisition. Previously masked peaks are now identifiable, without modification to the instrument. All samples were easily separated and resolved, with the propylene glycol and glycerin overloading minimalised/ eliminated. Using a scan segment method prevents extensive sample preparation and lengthy sample processing.
All e-liquids exhibit similar profiles with the exception of the cherry tree e-liquid which has a noticeably larger peak at approximately 2 minutes (discussed later).
The NIST spectral library was used to identify and confirm each component in all samples. The results of which are shown in Table 2, with comparison of all e-liquids analysed.
The original neat injection was used to identify and confirm the propylene glycol, glycerin and nicotine with all other peaks identified using the diluted, scan segment chromatogram.
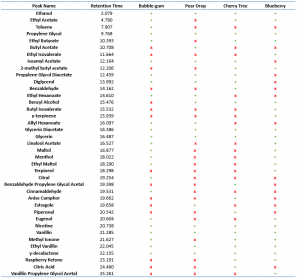
Table 2. Comparison of the identified composition of e-liquids ( + = present in the sample, x = not present in the sample)
As expected, all e-liquids contained the base ingredients listed on the packaging (propylene glycol, vegetable glycerin and nicotine. However, 36 other ingredients were also detected between the four samples. Ethanol is a common impurity that was identified in all e-liquid samples with toluene only being identified in the bubble-gum flavoured e-liquid.
These impurities are not regulated compounds during e-liquid manufacturing and are routinely used as solvents for the addition of flavouring additives to e-liquids[3]. Ethanol was identified at 2.079 minutes. As stated earlier, this peak was significantly greater in the cherry tree sample when compared to the other three e-liquids analysed.
All compounds contained glycerin diacetate which is an additive commonly found in products containing artificial flavourings. Additionally, all samples contain vanillin and ethyl vanillin which provides the e-liquids with a vanilla base flavour as well as γ-decalactone which contributes to a peach flavour. No samples contain the exact same flavour profile however, bubble-gum, pear drop and cherry tree all contain isoamyl acetate which gives a banana flavour. Select flavours were only present in individual e-liquids; piperonal is only present in the Cherry Tree e-liquid and is the main compositional providing the cherry flavour. The majority of the flavour compounds detected in the e-liquids are naturally occurring, including menthol (peppermint oil), terpineol (pine oil) and eugenol (cinnamon/nutmeg).
Figure 4 details the calibration curve for the prepared nicotine standards.
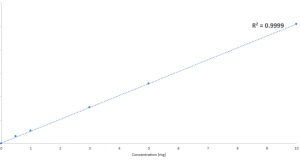
Figure 4. Calibration curve of nicotine
Nicotine has excellent linearity on the Scion 436 GC with SQ MS. The software was used to calculate the concentration of each e-liquid sample with Table 3 detailing the results.

Table 3. Listed concentration and actual concentration of nicotine
As shown in Figure 4, the actual concentration of nicotine in each sample showed variation with the exception of the blueberry sample which contained exactly 3mg of nicotine. However, the variances in nicotine in the remaining samples were no greater than a 7% difference. Manufacturing regulations does not stipulate a deviation acceptance criteria but rather limitations to the amount of nicotine allowed in the e-liquids, which is currently set to 20mg in Europe, significantly lower than the concentration of analysed e-liquids[2].
Conclusion
The Scion 436 GC with 8400 autosampler and single quad mass spectrometer was used to analyse four commercially available e-liquid samples. A full scan method was developed with a scan segment acquisition for the complete composition analysis and characterization of flavours and impurities in e-liquids. Optimisation of the scan segment method eliminated time consuming data processing associated with complex chromatograms and eliminated the requirement for extensive sample preparation. Although no e-liquids exhibited the same flavour profile, there were common flavours which were present in all e-liquids, including base flavours such as vanilla and banana. Additionally, there was minimal variance in the nicotine content between listed nicotine concentration and calculated nicotine concentration.
Download Application Note
Download the complete Application Note: The Analysis of Electronic Cigarette E-Liquid Ingredients by GC-MS
Analysing e-Liquid Ingredients with SCION’s Gas Chromatograph
Our Gas Chromatography Analyser was used to conduct this research. Providing excellent solutions for Environmental, Oil and Gas and Chemical industries, find out more about SCION GC Analysers. Alternatively if you would like to discuss any specific requirements you may have simply contact us. We look forward to being of assistance.
References
[1] Grand View Research (2019). E-cigarette and Vape Market Size and Trends Analysis. San Francisco: Grand View Research Inc.
[2] European Parliament and the Council of the European Union (2014). Directives of Tobacco and Related Products. Official Journal of the European Union.
[3] Valentine, G., Jatlow, P., Coffman, M., Nadim, H., Gueorguieva, R. and Sofuoglu, M. (2016). The effects of alcohol-containing e-cigarettes on young adult smokers. Drug and Alcohol Dependence, 159, pp.272-276.