Gasoline Range Organics (GRO) by Headspace GC-FID
Introduction
Recent oil spills in the Gulf of Mexico and the Great Barrier Reef have renewed interest in the rapid analysis of crude oil by-products in aqueous and solid samples including sand and commercial fishing products. One of the crude oil constituents, gasoline range organics (GRO) is currently determined by either EPA Method 8015C1 or Wisconsin’s modified GRO2.
A SCION Instruments HT3 Headspace Analyzer was used in both the static and dynamic modes to determine GRO in water using the SCION 8300 platform. The static method was linear from 50 to 1000ppb and the dynamic from 2 to 200ppb. This calibration data meets the requirements for both EPA Method 8015C and Wisconsin’s modified GRO.
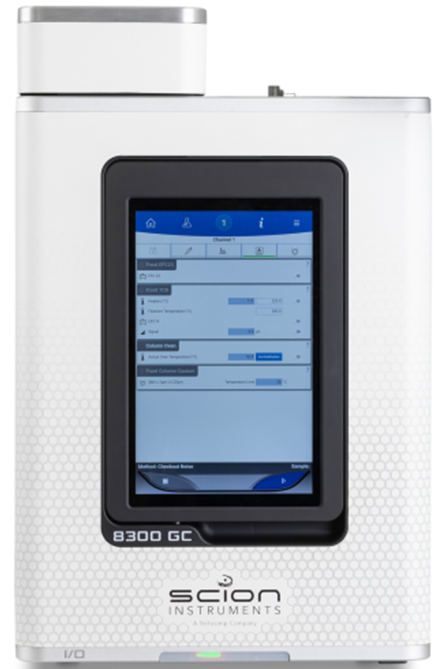
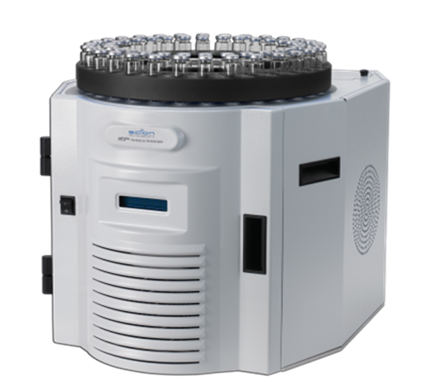
Figure 1. SCION HT3 Headspace Sampler together with the SCION Instruments 8300 GC platform.
Experimental-Instrument Conditions
A constant flow of 5mL/min with a 20:1 spilt was used to assist the oven program perform adequate separation of the GRO standards in under 9 minutes. The total GC cycle time was less than 16 minutes. A 1mm ID inlet split liner was chosen to provide better performance for use with the headspace analysis.
The analytical trap used during the dynamic analysis was a adsorbent trap. This trap was chosen to meet the higher system pressure from an increased vial sweep flow of 200mL/min. This higher sweep flow was used to shorten the headspace cycle time to less than the GC cycle time of 16 minutes.
Table 1 displays the GC/FID, and HT3 headspace conditions.
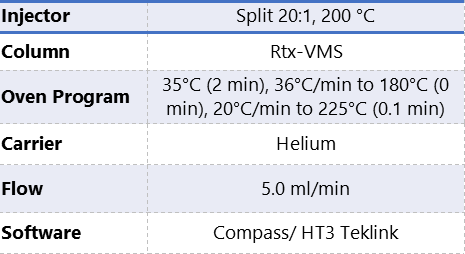
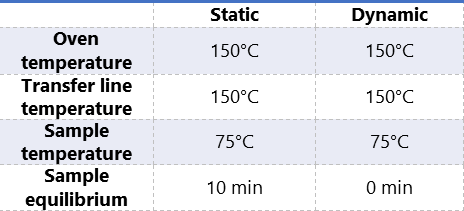
Table 1. Instrumentation operating conditions.
Calibration
To evaluate the system’s linearity, calibration standards were analyzed from 2-200ppb for the dynamic mode and 50-1000ppb for the static mode. These standards contained: methyltert-butyl ether (MtBE), benzene, toluene, ethylbenzene, o-xylene, m-xylene,p-xylene,1,3,5-trimethylbenzene,1,2,4-trimethylbenzene and naphthalene.
MDLs and percent recoveries were determined by using 2ppb and 20ppb standards respectively in the dynamic mode. Since the static mode is used for higher concentrations these determinations were not employed as they are below the static calibration range.
The dynamic headspace method was performed with 5mL of the standard solution in a sealed 22mL headspace vial. The static headspace method was performed with 10mL of the standard solution in a sealed 22mL headspace vial.
Dynamic Calibration
The dynamic calibration data was processed using Compass software for the method analyte range of 2ppb to 200ppb.
EPA Method 8015C1 allows the use of average calibration factors when the percent relative standard deviation (%RSD) is less than 20%.
When the %RSD is greater than 20%, linearity through the origin cannot be assumed and other calibration options may be used, such as linear not through the origin. To be used for quantitative purposes EPA Method 8000.3 requires the correlation coefficient to be greater than 0.99.
The Wisconsin modified GRO2 method uses the external standard method of the sum of the total response within the range of methyl tert-butyl ether to naphthalene. The analytes are calculated from the linear regression. The correlation coefficient must be greater than 0.99.
Table 2 displays the %RSD and linear correlation using the external standard method for the 2ppb to 200ppb standards.
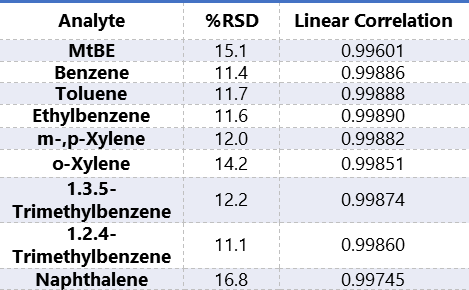
Table 2. %RSD and linear correlation coefficient for the 2 ppb to 200 ppb calibration curve.
Dynamic MDL and Recovery
The MDL was calculated from 8 replicates of a 2ppb standard. The percent recovery was calculated from 8 replicates of a 20ppb standard. Table 3 presents these values calculated as an external standard method by both the average response factor and from the linear curve.
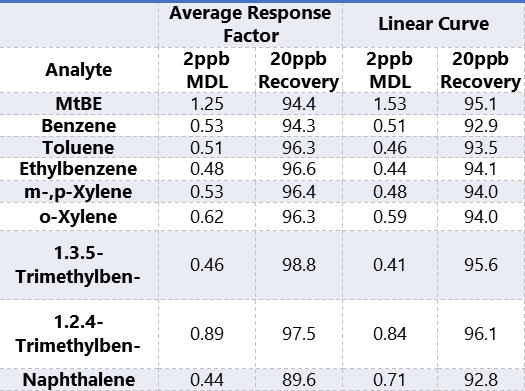
Table 3. MDL and 20ppb recovery data calculated by external standard.
Static Calibration
The static calibration data was processed using Compass software for the method analyte range of 50ppb to 1000ppb.
EPA Method 8015C1 allows the use of average calibration factors when the percent relative standard deviation (%RSD) is less than 20%. When the %RSD is greater than 20%, linearity through the origin cannot be assumed and other calibration options may be used, such as linear not through the origin. To be used for quantitative purposes EPA Method 8000 requires the correlation coefficient to be greater than 0.99.3
The Wisconsin modified GRO2 method uses the external standard method of the sum of the total response within the range of methyl tert-butyl ether to naphthalene. The samples are calculated from the linear regression. The correlation coefficient must be greater than 0.99.
Table 4 displays the %RSD and linear correlation using both the external standard method for the 50ppb to 1000ppb standards.
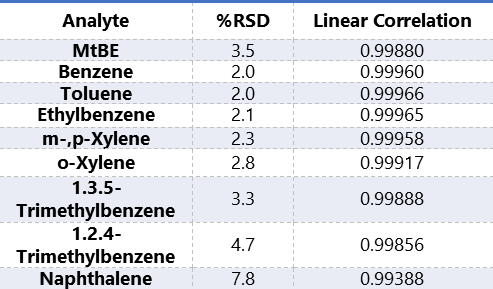
Table 4. %RSD and linear correlation coefficient for the 50 ppb to 1000 ppb calibration curve.
The chromatogram of the 50ppb standard from both the static and the dynamic methods were compared in Figure 2. This indicates the increased sensitivity that the dynamic headspace method offers versus the static method.
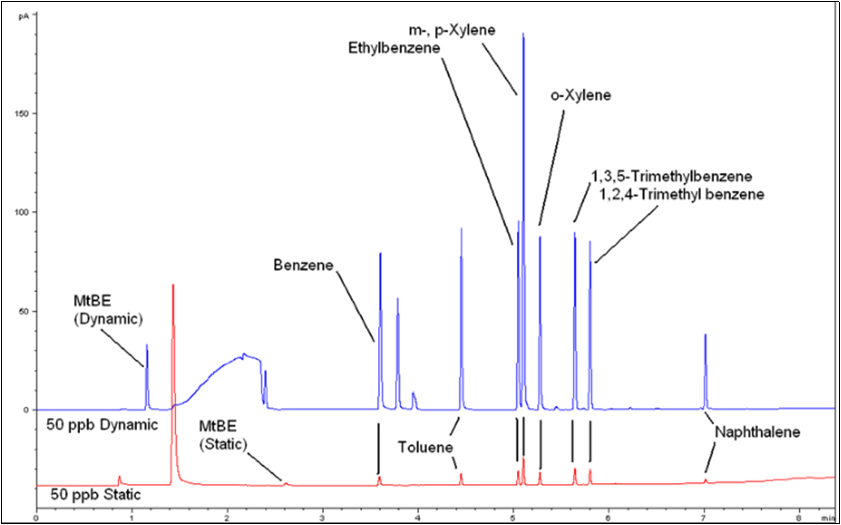
Figure 2. Same Scale Comparison of a 50ppb Standard with the Static Headspace Method (Bottom) to a 50ppb Standard with the Dynamic Headspace Method (Top).
Conclusion
The HT3 Headspace Analyzer provides the environmental laboratories performing GRO analysis the ability to detect GRO analytes from 2ppb to 1000ppb and greater with a single headspace instrument when used in conjunction with a GC with a FID detector. The analysis can be completed in less than 16 minutes per sample increasing sample throughput for GRO analysis.
The headspace GC/FID methods fall within the linearity requirements of EPA Method 8015C1 and Wisconsin GRO method2.
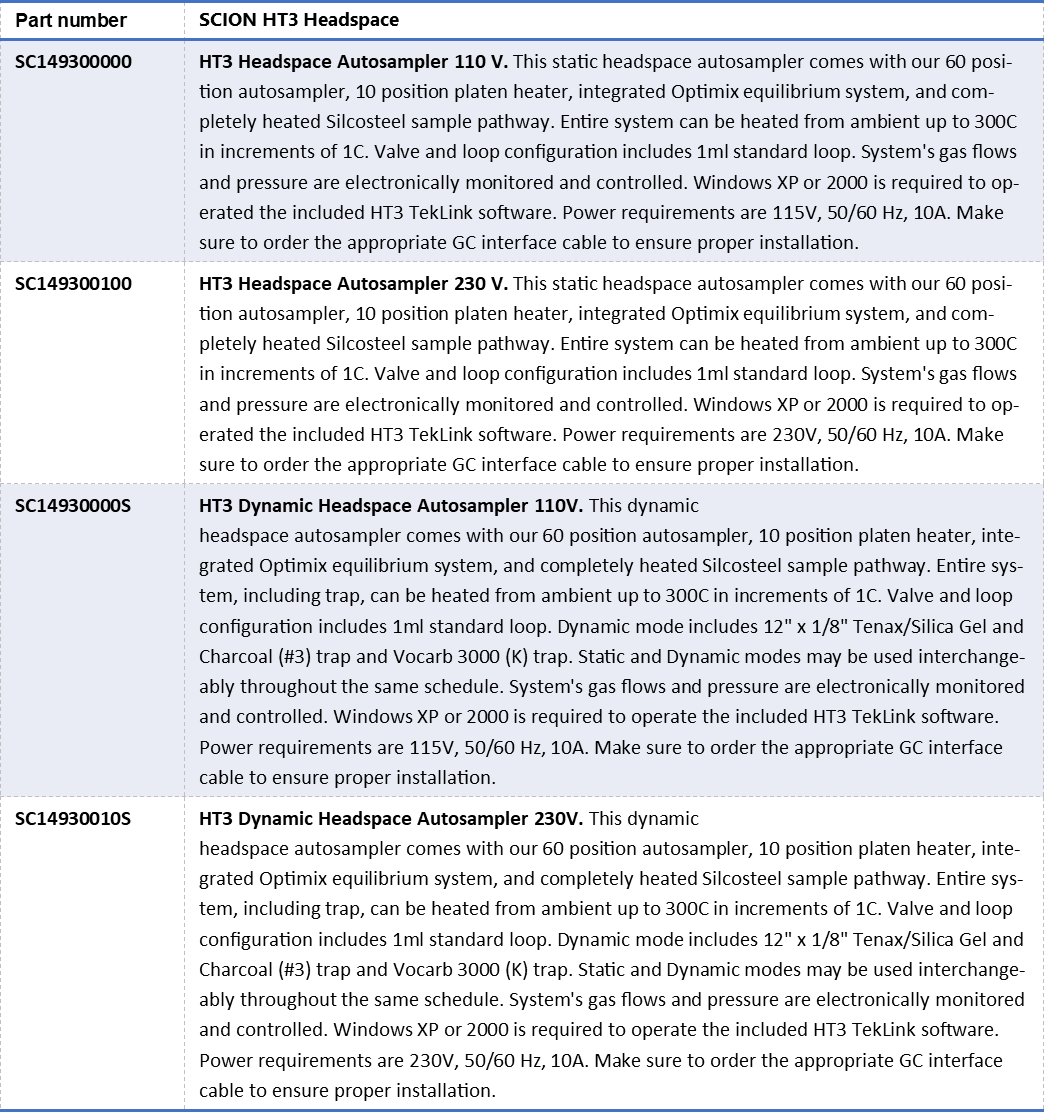
Order Information
Download Application Note
Download complete Application Note here: Gasoline Range Organics (GRO) by Headspace GC-FID
Keep in Touch
If you wish to keep up to date with SCION Instruments latest research and articles, why not join us on social media and sign up to our Linkedin newsletters today?