Headspace Assay of Polymers used in the Automotive Industry with an HT3 Dynamic Headspace Instrument
INTRODUCTION
Synthetic and natural materials are used extensively by the motor vehicle industry to provide customers appealing and safe vehicle interiors. The materials used in all aspects of vehicles interior, range from cloth and leather seats to the plastics used in the dashboards. The manufacturing process used for these materials typically include volatile (VOC) and semi volatile organic compound (SVOC) which are released into the interior of vehicles.
The headspace method using SCION Instruments HT3 with the dynamic option and the same trap material used in VDA278 provides a consistent method for the analysis of these polymers.
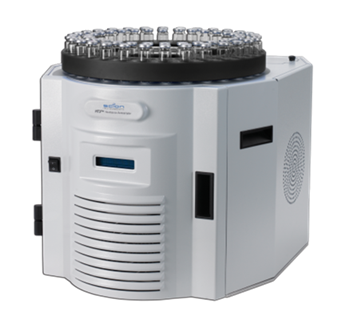
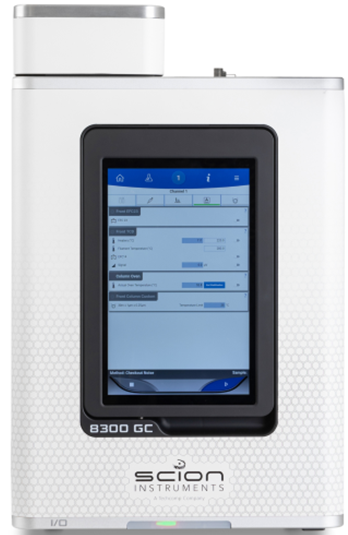
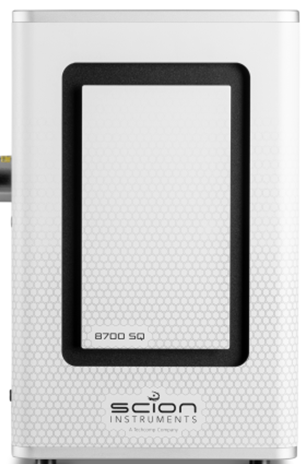
Figure 1. SCION HT3 Headspace Sampler together with the SCION Instruments 8300 GC platform in combination with to 8700 SQ-MS.
EXPERIMENTAL
Synthetic and natural materials are used extensively by the motor vehicle industry to provide customers appealing and safe vehicle interiors. The materials used in all aspects of vehicles interior, range from cloth and leather seats to the plastics used in the dashboards. The manufacturing process used for these materials typically include volatile (VOC) and semi volatile organic compound (SVOC) which are released into the interior of vehicles.
These compounds give the vehicles that new smell but can also lead to fog on the interior glass surfaces of the car and health issues with the occupants. Vehicle manufactures and government regulatory agencies are investigating limits relating to the VOC and SVOC and their allowable concentrations in the interior of vehicles.
The Japanese Automotive Manufactures Association (JAMA) and the voluntary program for the European Automotive Industry, VDA, whose limits are defined by TÜVRheinland are two of these agencies. Their limits are listed in Table 1.
The typical method of collecting VOC and SVOC from the vehicle cabin is to flow air through the cabin and collect these compounds on thermal desorption tubes. The tubes are then tested with a thermal desorption instrument.
Thermal desorption is well suited for the final testing of the vehicle interiors. However, it has limitations for use by the manufactures of products that go into the vehicles interior prior to final assembly.
One method from the VDA for testing these materials, Method VDA-278, uses thermal desorption. It instructs the parts suppliers of the vehicle interior materials how to test their products to meet the vehicle manufactures requirements for VOC and SVOC.
Thermal desorption has some known disadvantages listed in VDA 278. Section 4.4.1, Trimming and Weighing of Samples for Thermal Desorption Tubes indicates that the sample must be reduced to fit into the thermal desorption tube, which has an internal diameter of 4mm. Section 6, Possible Errors, Known Problems, also indicates that heating of the sample that may be generated during the mechanical reduction can drive off VOC’s creating false negative results and should be avoided.
A headspace method was investigated to provide an alternate method for thermal desorption.
Table 1. VOC and SVOC allowable concentration limits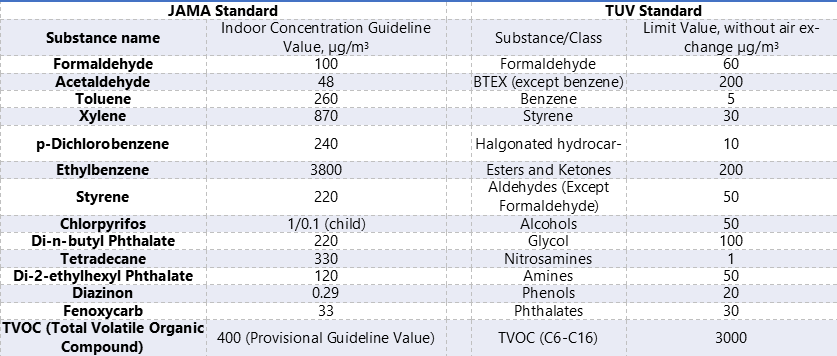
INSTRUMENT PARAMETERS
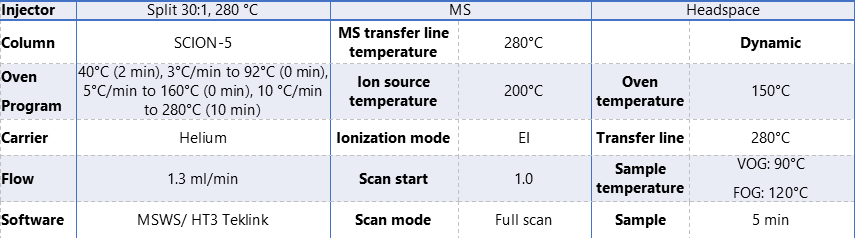
SCION Instruments HT3 Static Headspace instrument was connected to a SCION Instruments GC and mass Spectrometer. The headspace instrument conditions for the HT3 are presented in Table 2 together with the MS and GC conditions.
Table 2. Instrumentation operating conditions.
SAMPLE PREPARATION
Four automotive polymers were used for this report. Polymer A was a white polymer pellet ranging in size from 4 to 6mm in length and approximately 4mm in diameter. Polymer B was a black polymer rod approximately 3mm in diameter and approximately 10mm long. Polymer C was a black sheet of polymer 60mm square and 2mm thick. Polymer D was a white sheet of polymer 80mm square and approximately 1mm thick.
Approximately 100mg of each sample in duplicate were weighed into separate 22mL headspace vials. Six pellets of A were used without cutting the sample. Two rods of B were used without cutting the sample. Square pieces (approximately 7mm) of C were cut from the sheet. The first sample of C was a single sample cut from the sheet. The second sample was two pieces cut from the sheet, which increased the sample surface are due to the second cut. Single pieces (approximately 10mm by 7mm) of D were cut from the sheet.
The 2 vials for each polymer were analyzed first with the VOC headspace method and the VOC GC/MS method. Following VDA 278, only the second vial was then analyzed with the FOG headspace method but with the VOC GC/MS method. The VOC GC/MS method was used for this FOG headspace analysis to allow a comparison of the data from both headspace methods with the peaks of interest at the same retention time instead of separate retention times.
DATA
All four polymer samples produced numerous peaks. The Total Ion Current (TIC) chromatograms of the two vials for each polymer analyzed by the VOC headspace method were compared to determine if the headspace method was reproducible. Figures 2, 3, 4 and 5 are the comparison of the same sample in 2 separate vials.
The TIC chromatogram from the second vial used for the VOC headspace analysis was compared to the TIC chromatogram of the FOG headspace analysis of the second vial. Figures 6, 7, 8, and 9 are the comparison of the second vials VOC TIC chromatogram and the FOG TIC chromatogram. Figure 10 is the same polymer from Figure 9, but expanded.
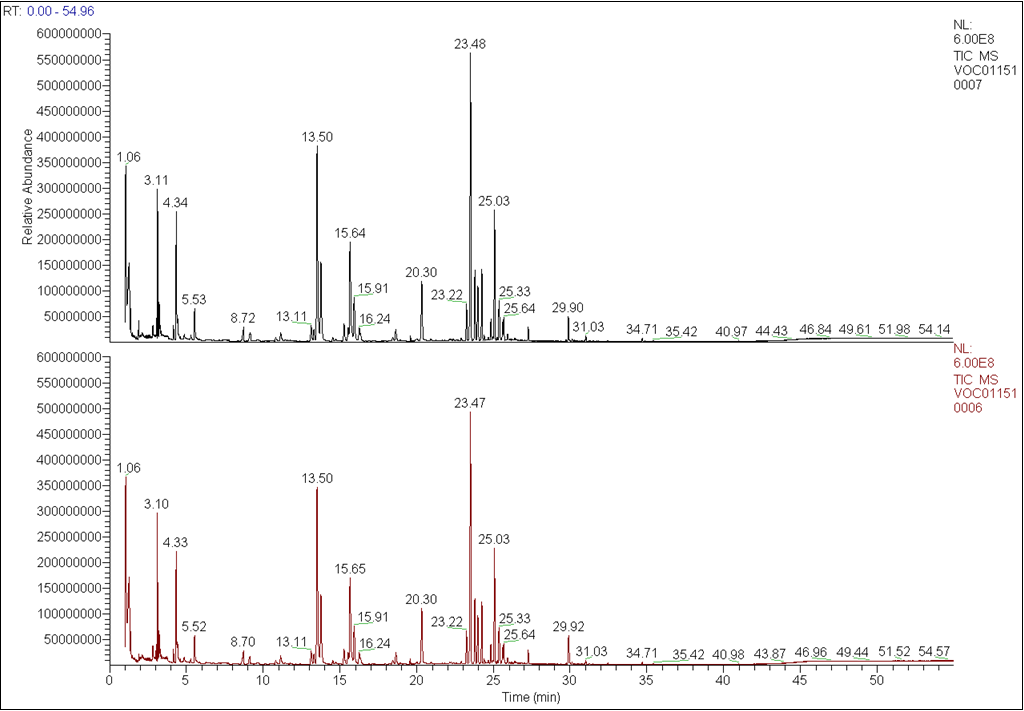 Figure 2. Comparison of the TIC Chromatogram for 2 samples of polymer A
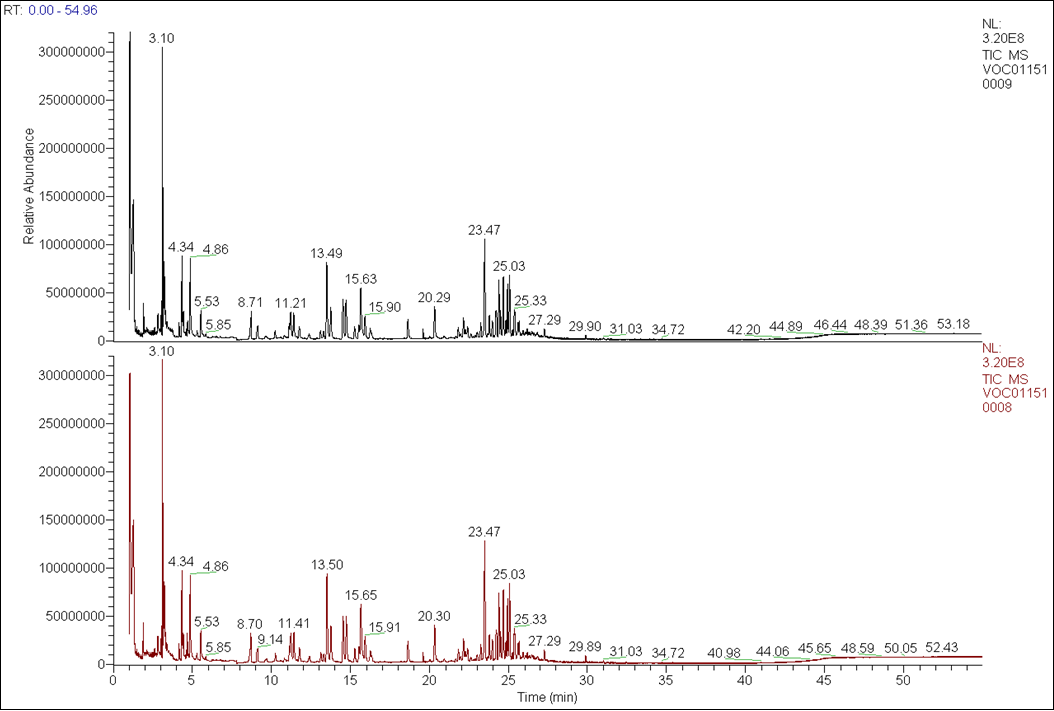 Figure 3. Comparison of the TIC chromatogram for 2 samples of polymer B.
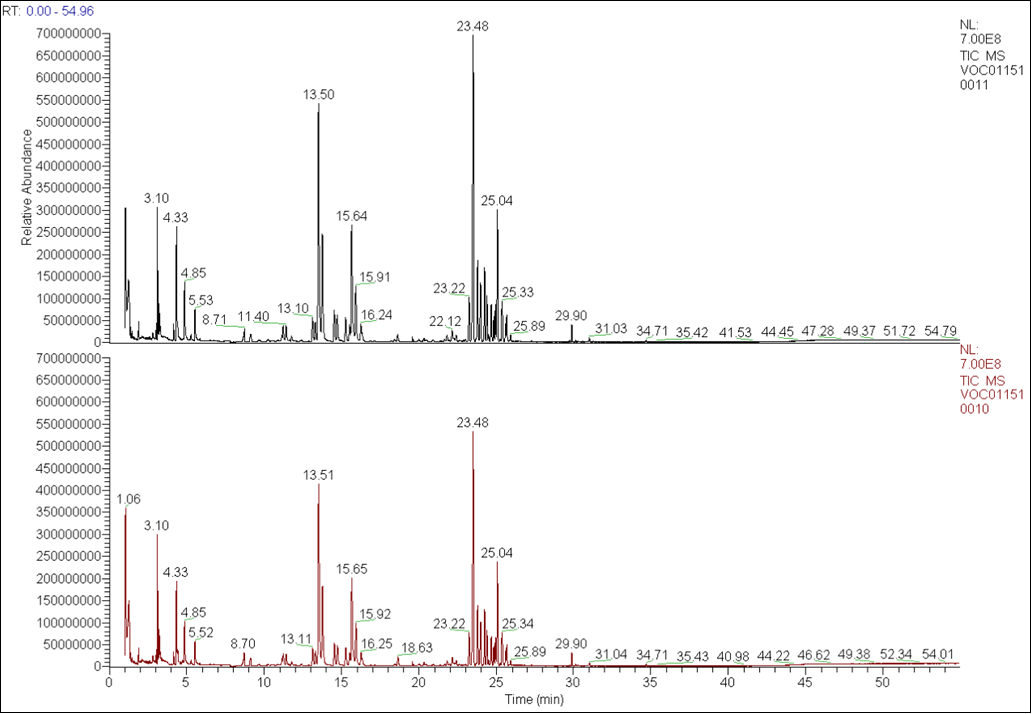
Figure 4. Comparison of the TIC chromatograms for the 2 samples of Polymer C. The upper TIC is of the sample with 2 pieces in the vial instead of a single piece exhibiting the influence of surface area of this method.
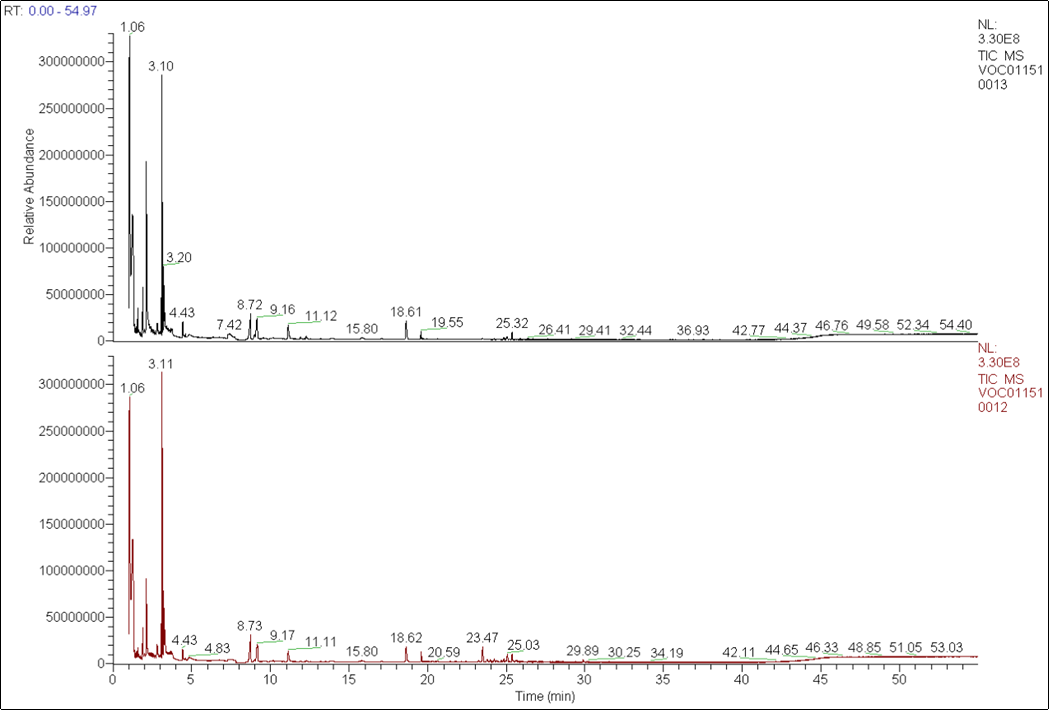
Figure 5. Comparison of the TIC chromatograms for 2 samples of Polymer D.
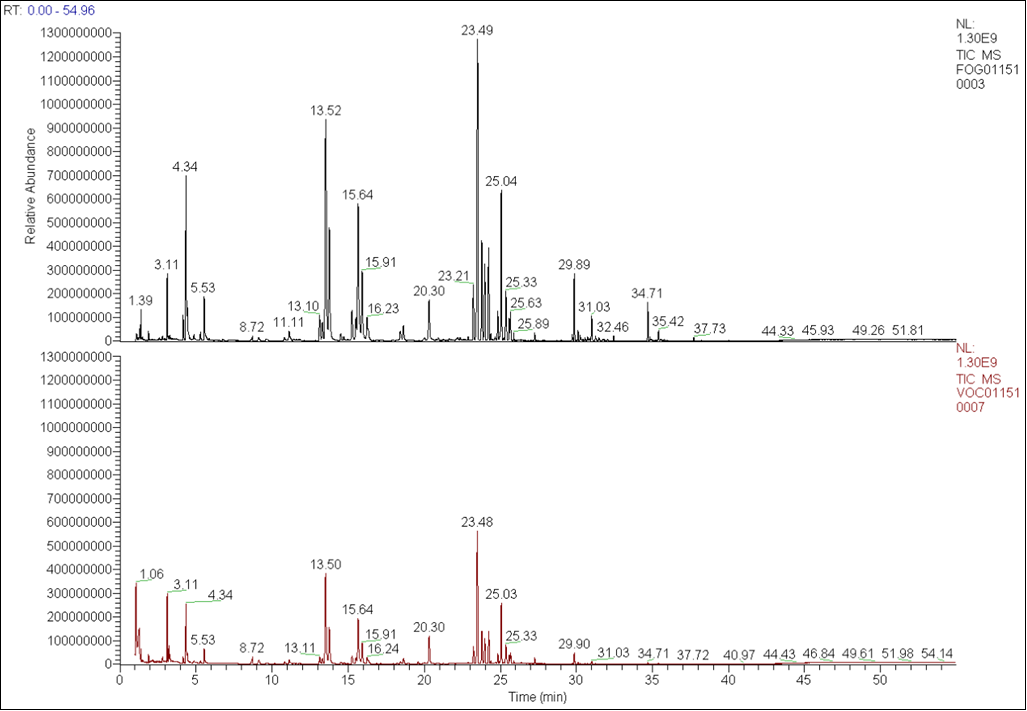
Figure 6. Comparison of the second vial’s VOC (lower) and FOG (upper) TIC Chromatogram for Polymer A. The FOG headspace analysis has additional peaks not observed in the VOC headspace analysis.

Figure 7. Comparison of the second vial’s VOC (lower) and FOG (upper) TIC Chromatogram for Polymer B. The FOG headspace analysis has additional peaks not observed in the VOC headspace analysis.
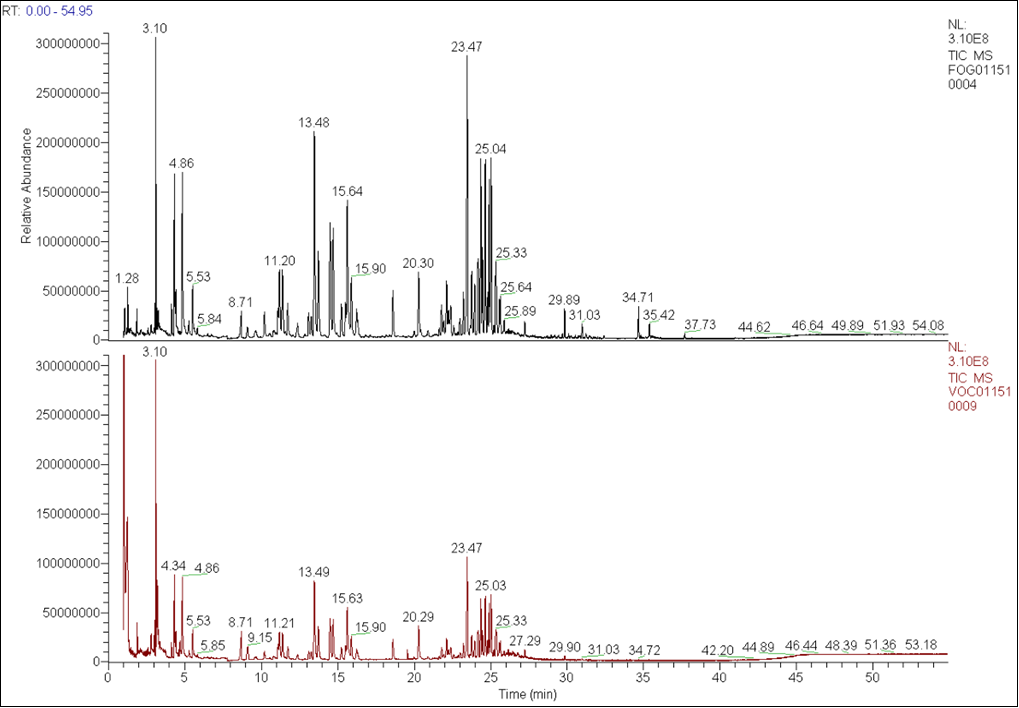
Figure 8. Comparison of the second vial’s VOC (lower) and FOG (upper) TIC Chromatogram for Polymer C. The FOG headspace analysis has additional peaks not observed in the VOC headspace analysis.

Figure 9. Comparison of the second vial’s VOC (lower) and FOG (upper) TIC Chromatogram for Polymer D. The FOG headspace analysis has additional peaks not observed in the VOC headspace analysis.
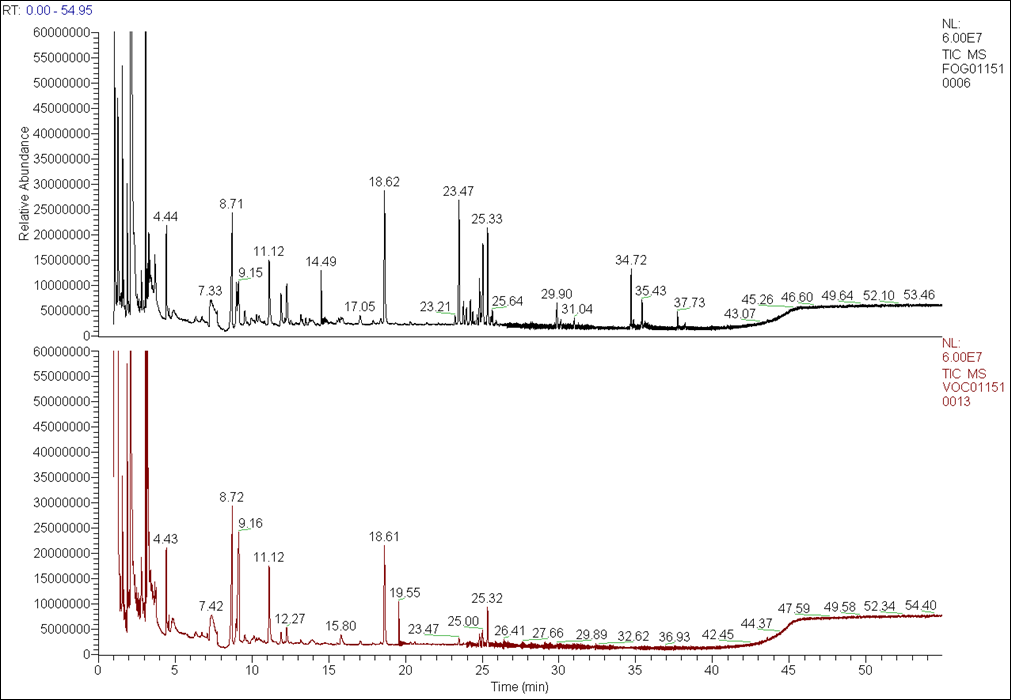
Figure 10. Enlarged scale of the TIC chromatograms from Figure 8 indicating the additional peaks in the FOG headspace analysis.
CONCLUSION
VDA 278 is currently used by the vehicle manufactures and their supplies to test manufactured materials for VOC and SVOC emissions. The method uses thermal desorption to analyze the sample. This requires reduction of the sample size to fit into thermal desorption tubes internal diameter of 4mm. The method indicates that care must be taken to avoid heating the sample during sample size reduction to avoid driving off the VOC and SVOC’s.
The headspace method using SCION Instruments HT3 with the dynamic option and the same trap material used in VDA278 provides a consistent method for the analysis of these polymers. Two of the samples were raw polymer pellets and were placed directly into the headspace vial without the need for sample size reduction. Two polymers samples were sheets of the material, and required that a square piece cut from the sheet.
Polymer A, B, and D indicated consistent results between the sample vials when similar pieces of polymer was present. Polymer C samples consisted of a single piece of polymer for one vial and two pieces of polymer for the second vial to maintain the same sample weight. The same peaks were observed for the two samples. However the sample with a greater surface area had higher concentrations of these peaks.
The headspace method was also used to determine if difference in the polymers could be detected when the same vial was used for both the VOC analysis at 90°C and then reused for the FOG analysis at 120°C. All four polymer samples showed a difference between the VOC and the FOG headspace method.
ORDER INFORMATION
Download Application Note
Download complete Application Note here: Headspace Assay of Polymers used in the Automotive Industry with the HT3 Dynamic Headspace Instrument.
Keep in Touch
If you wish to keep up to date with SCION Instruments latest research and articles, follow us on social media and sign up to our newsletter below.