Analysis of Flavours in Beer with SCION ChromSync Software
One of the most widely purchased beverages in the world is beer. With the consumer market so large, breweries are developing their products to have its own distinct flavour. It is vital that breweries test and monitor the flavour compounds during the production process to ensure that the same flavours are consistently achieved. The volatile compounds that make up the flavour composition must therefore be profiled batch to batch.
Gas chromatography (GC) is often the instrumentation of choice for the analysis of flavour active volatiles in beer. Compass Chromatography Data System (CDS) is a state of the art chromatography software platform that controls GC instruments whilst offering automated processing and reporting of results. ChromSync is an application add on specifically for the flavour and fragrance industry. ChromSync has the ability to determine the ‘fingerprint’ of flavour compounds in beer. The individual ‘fingerprints’ are then compared with a reference standard. ChromSync rapidly compares peak retention time as well as area% profiles of complex chromatograms, making processing volatile flavour profiles effortless. Additionally, ChromSync instantly confirms product batch to batch reproducibility whilst reporting any missing compounds and calculating the degrees of similarity.
This application note demonstrated the ease of using Chromsync with CompassCDS for the comparison of five beer samples analysed via headspace gas chromatography (HS-GC) with flame ionisation detection (FID).
Experimental
Figure 1 details the instrumentation used throughout this application. A SCION 456 GC-FID was coupled with the Teledyne Tekmar HT3 headspace autosampler.
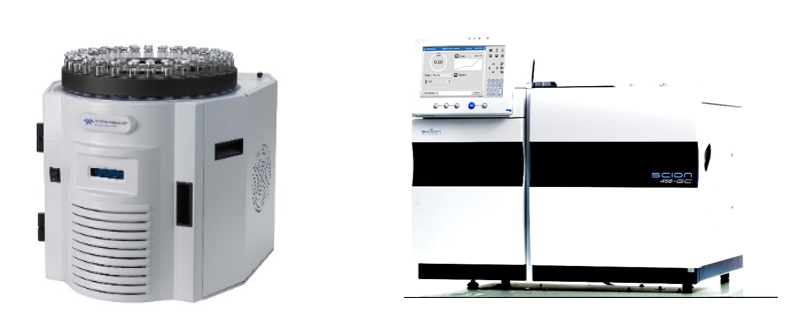
Figure 1. SCION GC-FID with Tekmar HT3 Headspace autosampler
Five commercially available beers were prepared in 20mL HS vials; 5mL of each sample was added with 3g of NaCl. The samples were thoroughly mixed, ready for injection onto the analytical system. The five beers analysed were labelled as Reference Sample, Sample A, Sample B, Sample C and Sample D. The analytical parameters used can be found in Tables 1 and 2.
Table 1. Analytical conditions of the Teledyne Tekmar HT3 HS autosampler
| Conditions | |
| Oven | 80°C |
| Sample Loop | 80°C |
| Transfer Line | 100°C |
| Vial Equib Time | 20 minutes |
| Fill Pressure | 15psi at 50mL/min |
| Inject Time | 0.5 minutes |
Table 2. Analytical conditions of the SCION GC-FID
| Conditions | |
| Injector | S/SL 25:1, 140°C |
| Column | SCION-Wax 30m x 0.53mm x 1.0µm |
| Oven | 40°C (3 mins), 10°C/min to 120°C , 20°C/min to 200°C |
| Carrier | Helium, 2mL/min |
| FID | 250°C |
Results
For the purposes of demonstrating the capabilities of ChromSync it was not required to identify the individual flavour compounds. Figure 2 shows the chromatogram of the reference sample.
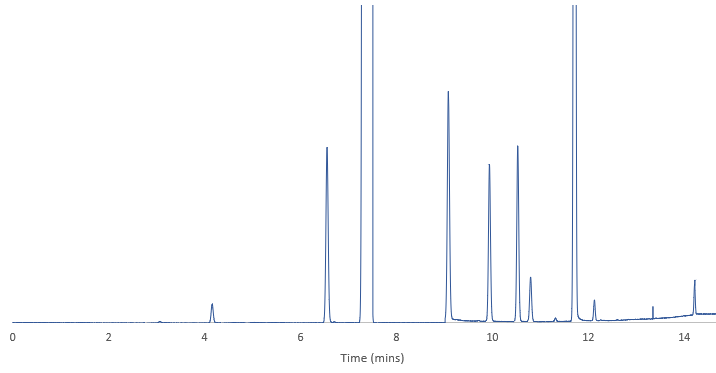
Figure 2. Flavour profile of the Reference Sample
Manual comparisons of different flavour profiles is a time extensive process with an increased chance of error in reporting of results, especially in highly complex chromatograms. ChromSync is an automated comparison application that eliminates the need for manual comparisons thus increasing both lab accuracy and productivity.
ChromSync automatically determines tolerance levels for peaks set in the reference sample, however, users can set their own acceptable levels based upon their own methods.
These tolerance levels are then used to determine if peaks present in the sample are identical to those in the reference sample and highlighted if they fall out of the accepted tolerance levels. Smaller peaks within both samples have larger tolerance limits as standard. This is an excellent identification tool for monitoring any changes during the fermentation of beer and comparing batch to batch discrepancies; vital for quality control of beer production. On the comparison charts, the lower markers represent the Reference Sample with the comparative sample being the top markers. The peak area is represented by the size of the markers.
Figure 3 shows the comparison between Reference Sample and Sample A when the tolerance limits were left as predefined.
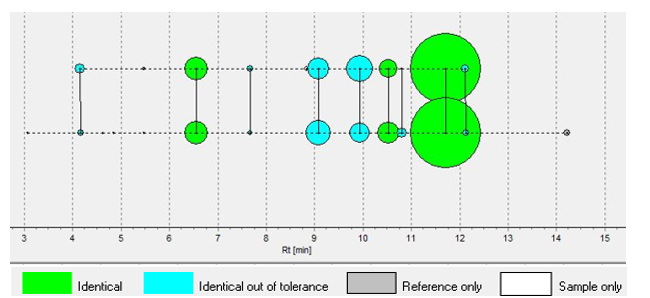
Figure 3. Reference beer sample and Sample A comparison
The green markers show the identical peaks within both samples whereas the blue markers show identical peaks that are out of the predefined tolerance levels. Adjusting the tolerance levels to those acceptable to specific brewery quality control limits alters the blue markers to green, showing identical peaks are present, as shown in Figure 4.
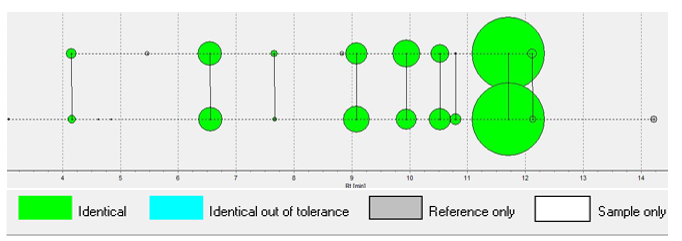
Figure 4. Adjusted tolerance levels of Figure 3 samples
The identical peak match for Figure 3 was 18.75% with 37.50% out of the tolerance level. With adjustment to the processing parameters, the identical peak match increased to 60% with zero out of tolerance peaks. 26.67% of the remaining peaks were present in the Reference Sample only, with the other 13.33% present only in Sample A. The adjusted tolerance parameters were used for the remainder of the comparisons. Figure 5 shows the comparison between the Reference Sample and Sample B.
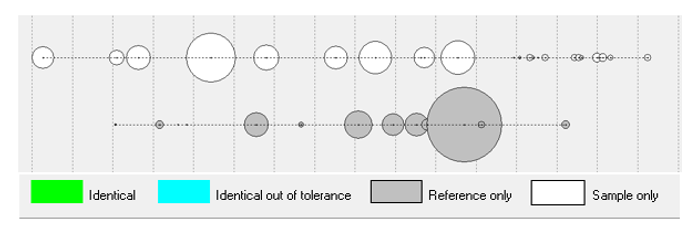
Figure 5. Reference beer sample and Sample B comparison
Sample B, a Turkish beer, has a completely different flavour profile when compared to the reference sample. There were no identical flavours between the two samples, as represented by the white and grey markers in Figure 5. Noticeably, Sample B contains more flavour components than the reference sample.
The comparison of the Reference Sample and Sample C is shown in Figure 6. 30% of both samples contained the same flavour compounds, with an additional 10% in the out of tolerance range for Sample C. The larger blue markers show that the peak area of the aromas in Sample C are significantly greater than those in the Reference Sample hence the out of tolerance marker.
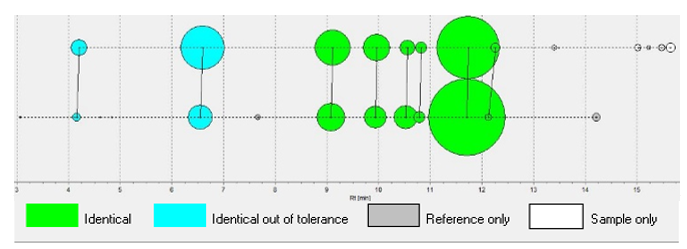
Figure 6. Reference beer sample and Sample C comparison
Figure 7 details the comparison between the Reference sample and Sample D.
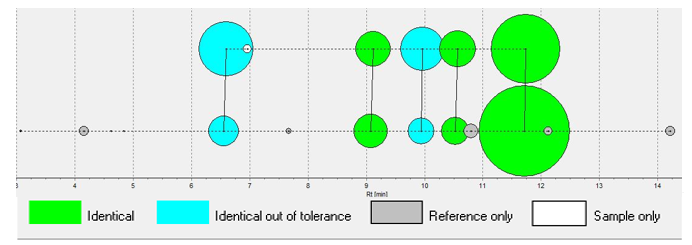
Figure 7. Reference beer sample and Sample D comparison
21.43% of the flavour aromas, of both the Reference Sample and Sample D were identical, with 14.29% out of the tolerance range.
As with Sample C, the peak areas of these aromas in Sample D are larger than the defined tolerance limit. Sample D is missing 57.14% of the flavours found in the Reference Sample and contains an additional 7.14% flavours not found in the reference sample.
Figure 8 shows the overlay flavour profile of all beer samples including the reference standard. It is easy to visualise the similarities and differences between not only the different flavours but the different peak areas that constitute the samples.
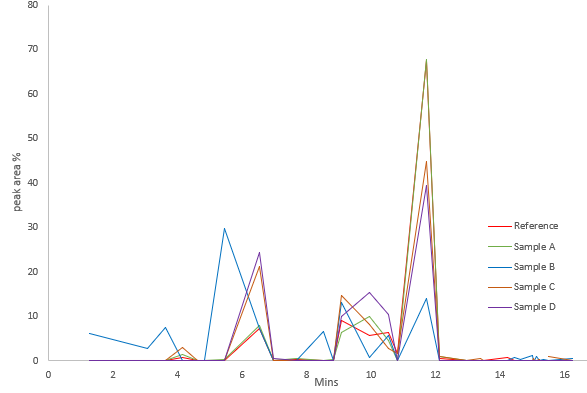
Fig 8. Overlay flavor profiles of all beer samples.
Table 3 details the individual flavour compounds found in all beer samples analysed and processed using the ChromSync add on for CompassCDS. Chromsync accurately performs comparisons regardless if there are issues surrounding peak distortion, scaling, column aging, retention time shifts and even changes in experimental conditions.
Table 3. Peak area % of each flavour compound, in each beer sample
| RT REF | Reference | A | B | C | D |
| 1.27 | – | – | 6.0552 | – | – |
| 3.07 | 0.0565 | – | 2.7341 | – | – |
| 3.64 | – | – | 7.3901 | – | – |
| 4.16 | 0.7419 | 1.3869 | – | 3.0093 | – |
| 4.62 | 0.0057 | – | – | – | – |
| 4.84 | 0.0198 | – | – | – | – |
| 5.43 | – | – | 29.7991 | – | – |
| 5.47 | – | 0.2133 | – | – | – |
| 6.55 | 7.2185 | 7.8772 | – | 21.2165 | 24.4384 |
| 6.81 | – | – | 7.2185 | – | – |
| 6.96 | – | – | – | – | 0.514 |
| 7.67 | 0.3362 | 0.5217 | – | – | – |
| 8.53 | – | – | 6.5918 | – | – |
| 8.83 | – | 0.301 | – | – | – |
| 9.08 | 9.1647 | 6.396 | – | 14.6471 | 9.9399 |
| 9.50 | – | – | 13.1803 | – | – |
| 9.94 | 5.7562 | 9.968 | – | 8.0822 | 15.2803 |
| 10.53 | 6.334 | 4.5821 | – | 2.7861 | 10.4596 |
| 10.63 | – | – | 0.6511 | – | – |
| 10.72 | – | – | 5.5788 | – | – |
| 10.8 | 1.6139 | 0.0399 | – | 1.6156 | – |
| 11.54 | – | – | 13.9813 | – | – |
| 11.71 | 67.4467 | 67.737 | – | 44.8106 | 39.3737 |
| 12.13 | 0.5905 | 1.0037 | – | 1.0191 | – |
| 12.94 | – | – | 0.0182 | – | – |
| 13.09 | – | – | 0.1813 | – | – |
| 13.40 | – | – | 0.1083 | 0.4114 | – |
| 13.48 | – | – | – | 0.0002 | – |
| 13.53 | – | – | 0.0206 | – | – |
| 14.22 | 0.7153 | – | – | – | – |
| 14.43 | – | – | 0.649 | – | – |
| 14.54 | – | – | 0.5817 | – | – |
| 14.61 | – | – | 0.326 | – | – |
| 14.99 | – | – | 1.1627 | – | – |
| 15.02 | – | – | – | 0.598 | – |
| 15.06 | – | – | 0.0605 | 0.0214 | – |
| 15.13 | – | – | 0.9254 | – | – |
| 15.22 | – | – | 0.0255 | 0.2131 | – |
| 15.33 | – | – | 0.3536 | – | – |
| 15.48 | – | – | – | 0.9753 | – |
| 16.25 | – | – | 0.5112 | – | – |
Conclusion
ChromSync is an application add on for CompassCDS chromatography software. Chromsync not only defines the ‘fingerprints’ of flavour profiles but also compares a reference standard chromatogram with a sample chromatogram to identify matching peaks, matching peaks outside of the set tolerance levels and also different peaks present in the two samples. Chromsync is the perfect data processing software for industries involved in flavours and fragrances, eliminating extensive manual processing times and the high risk of errors that are associated with manual comparison.
Download Application Note
Download the complete Application Note: Analysis of Flavours in Beer with SCION ChromSync Software
Headspace Gas Chromatography Solutions
A SCION Gas Chromatography Analyser was used to conduct this research. Providing excellent solutions for Environmental, Oil and Gas and Chemical industries, find out more about Scion GC Analysers.
If you would like to speak to a member of our team for more information, please don’t hesitate to get in touch. Or to stay in the loop regarding future research and articles from SCION Instruments, why not join us on social media and sign up to our eNewsletter today?