Active Pharmaceutical Ingredients Qualitative Analysis by GC-MS
Introduction
Active Pharmaceutical Ingredients (APIs) are the active components in a pharmaceutical drug that produce the required effect on the body to treat a condition. Analysis of APIs is important to provide quality assurance and regulatory compliance with authorities such as U.S. Food and Drug Administration (FDA) or European Medicines Agency (EMA). Consistency of pharmaceutical batches, detection of impurities and stability testing, identification, and quantification, are just a handful of requirements for the analysis of APIs.
Antihistamines are a class of drugs that counteract the effects of histamine, a natural occurring substance produced by the body as part of its immune response. These medications are commonly used to treat allergic reactions, hay fever, and other conditions where histamine release is a contributing factor. Some common APIs of antihistamines are loratadine, rupatadine and ebastine. Alternative drug categories include analgesics, antipyretics, and anti-inflammatories. For instance, paracetamol serves as both an analgesic and antipyretic, while ibuprofen functions as a non-steroidal anti-inflammatory. Therefore, close analysis of these components should be performed.
Because of the stringent analysis requirements mandated by various regulations, the implication of mass spectrometry is essential. Even though the analysis of these type of compounds is more suitable on LC/MS, GC/MS was found to be as capable and this application note showcases the power of a SCION 8500 GC equipped with the 8400 PRO autosampler and 8700 SQ-MS, shown in Figure 1. This application is also possible using the SCION 8300 GC along with 8700 SQ-MS.
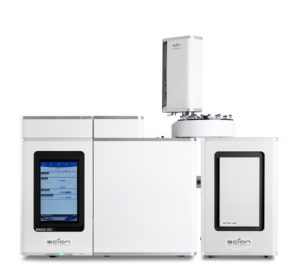
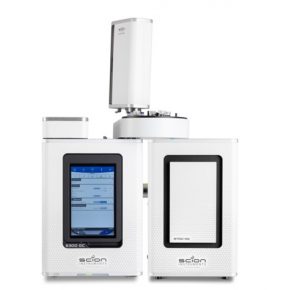
Figure 1. SCION Instruments 8300 GC and 8500 GC both equipped with 8400 PRO autosampler and 8700 MS.
This application note emphasizes the qualitative examination of the specified antihistamines through the analysis of both standards and samples and samples, including antihistamines, paracetamol, and ibuprofen. The identification process is supported by comparing the spectral characteristics between standards and samples, as well as using a library matching approach.
Experimental
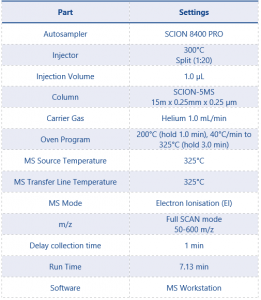
This application note was performed on the SCION Instruments 8500 GC equipped an 8700 SQ-MS and 8400 PRO autosampler. Table 1 details the instrument parameters used for this method.
Table 1. Instrument operating conditions
A standard mix containing loratadine, ebastine, and rupatadine was prepared at a concentration of 50 µg/mL. However, only a loratadine sample was available for analysis as rupatadine and ebastine are exclusively dispensed through prescription. Paracetamol and ibuprofen samples were also subjected to the same testing method mentioned earlier. All sample and standard preparation was performed using Acetonitrile as solvent.
Qualitative analysis involves comparing standards and samples, via retention time matches, while also consulting a reference library. The reference library used in this case was NIST20.
Results
Paracetamol and ibuprofen were exclusively examined as individual samples, and their spectra were compared to NIST 20. The samples were prepared by the crushing of a tablet using a mortar and pestle, and 10 mg of the resulting powder were measured to prepare a stock solution with a final concentration of 1 mg/mL, dissolved in Acetonitrile. Subsequently, this stock solution was further diluted to attain a final concentration of 100 µg/mL.
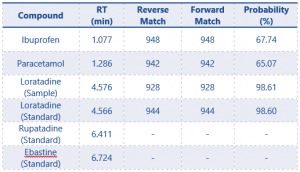
The peaks exhibited sharpness without noticeable fronting or tailing, indicating that the separated peaks are Gaussian shaped. These compounds were the first to elute, as indicated in Table 2. Both reversed and forward matches for these compounds surpassed 900, as shown in the same table, with the maximum achievable value of being 999. However, the probability was slightly lower, approximately 65 %, signalling a matrix effect attributed to the presence of unwanted m/z.
While a more intricate sample preparation method could mitigate this effect, it was beyond the scope of this application note. Nonetheless, the key focus remains on the reverse and forward matches, indicating the proximity of the sample spectra to the library spectra.
Table 2. Library Rever and Forward Matches, and Probability for the Paracetamol, Ibuprofen, Loratadine samples and Loratadine, Rupatadine and Ebastine Standard.
The expected m/z of the standards were seen in the spectra. For loratadine, m/z 382, 266, 245 were found, while rupatadine showed the main masses as being 309, 245, 107 and ebastine 167, 152 and 111 m/z. These values coincide with the ones reported by Katselou et al_2019 (1) and the results can be visualized in Figure 2, Figure 4, and Figure 5, which show the reports generated in MS Workstation.
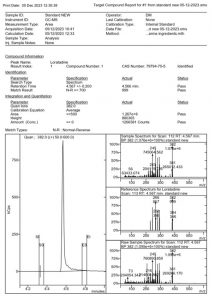
Figure 2. MSWS report of the Loratadine standard
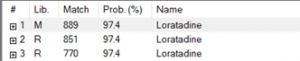
Figure 3. NIST20 library match of the Loratadine peak in the standard.
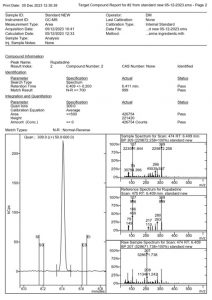
Figure 4. MSWS report of the Rupatadine standard
From a chromatographic standpoint, the peaks are sharp without notable fronting or tailing. A satisfactory resolution was attained for rupatadine and ebastine, both eluting closely at 6.409 and 6.724 min, respectively. The entire analysis is completed within 7.13 minutes, emphasizing the rapidity of the method.
As indicated in Table 2, no reversed and forward Match or Probability with the library was acquired because these compounds were not included in the library. Consequently, a definitive identification could not be established. However, the alignment of their mass spectra with the m/z values reported by Katselou et al_2019 (1), coupled with the use of EP certified standards, provides additional support for the accurate identification of these two antihistamines.
Figure 5. MSWS report of the Ebastine standard
The subsequent phase in the qualitative analysis involved running a loratadine sample procured from a pharmacy. One tablet was crushed using a mortar and pestle, and 10 mg of the resulting powder was weighed to create a stock solution with a final concentration of 1 mg/mL. This stock solution was further diluted with Acetonitrile to achieve a final concentration of 100 µg/mL. The MS Workstation report for the sample is depicted in Figure 5. The peak displays a well-defined shape with a slight tailing.
The retention time for both the standard and the sample align, with the standard at 4.567 minutes and the sample at 4.574 minutes. Additionally, the match result section in the Identification part of the report indicates a 99% match between the standard and the sample. Also, NIST analysis of the sample reveals a match of 98.2%, as illustrated in Figure 7. The reversed and forward match values for the sample exceeded 940, underscoring the accuracy of the identification. This information is depicted in Table 2. The substantial alignment between the library, standard, and the sample, coupled with the similarity in retention times, affirms the accurate identification of loratadine.
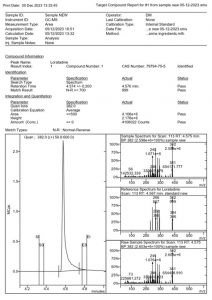
Figure 6. MSWS report of the Loratadine pill sample

Figure 7. NIST20 library match of the Loratadine peak in the sample.
Conclusion
The SCION 8300 GC and 8500 GC platforms, coupled with an 8700 SQ MS and 8400 PRO autosampler, offer an effective solution for the swift analysis of antihistamines within a concise timeframe of 7.13 minutes.
Despite being analyzed as samples, both paracetamol and ebastine exhibited perfect matches with the NIST 20 library. The relatively low probability, approximately 65%, was attributed to suboptimal sample preparation, indicating the presence of a matrix effect. However, the critical aspect lies in the reversed and forward matches, indicating the proximity of the sample spectra to the library spectra. In this case, the values surpassed 940, with the maximum value being 999, underscoring the accuracy of the identification.
Loratadine’s identification has been conclusively established through a meticulous comparison of standard and sample data, encompassing retention time and spectral information, as well as a comprehensive library search. All assessment criteria have consistently validated the identification of loratadine, with matches exceeding 98% and the reversed and forward match above 920. In the case of rupatadine and ebastine, although the library lacked these compounds, their identification was still confirmed. Despite the absence of matches, their mass spectra closely aligned with the m/z values reported by Katselou et al_2019 (1), and the utilized standards were EP certified, further substantiating the accurate identification of these two antihistamines.
In light of recent regulations mandating thorough documentation of active pharmaceutical ingredients (APIs), the presented analytical method holds significant relevance and importance.
References
1. Development and validation of an EI-GC-MS method for the determination of 11 antihistamines in whole blood. Applications in clinical and forensic toxicology. Katselou, Maria, et al. 4926, Stockholm: ROYAL SOCIETY OF CHEMISTRY, 17 September 2018, Analytical Methods, Vol. 10, pp. 4926-4934.
Download The Application Note
To get a PDF version and access ordering information, download the Application Note using the following link: Active Pharmaceutical Ingredients Qualitative Analysis by GC-MS