Achieving Low-Level Detection of Benzene in Beverages with an Automated Headspace Vial Sampler
Introduction
Eight commercially available beverage samples were selected for low-level detection of benzene by static headspace analysis. This study will use the SCION Instruments HT3 Automated Headspace Vial Sampler to analyze parts per trillion (ppt) levels of benzene in beverages. A GC/MS system will be employed in full scan/SIM mode for separation and detection of benzene, as well as other volatile compounds.
The HT3 was capable of detecting 0.05 parts per billion (ppb) of benzene in the samples with excellent linearity from 0.05 to 20 ppb. The 0.05 ppb quantitation level achieved is 20 times lower than the European benzene drinking water requirement of 1 ppb.
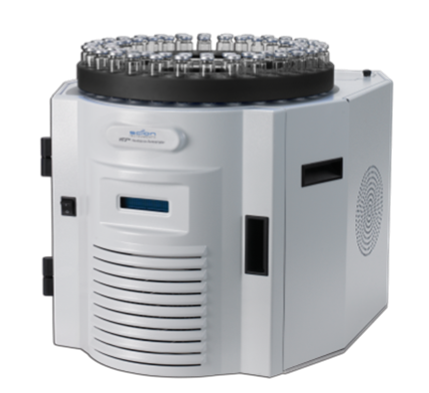
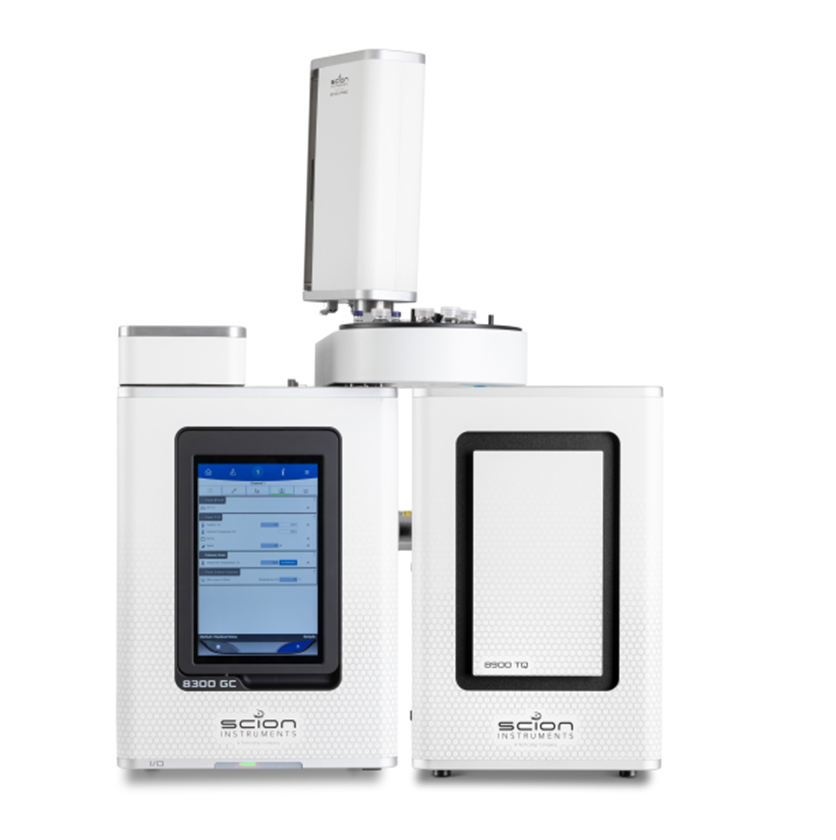
Figure 1. SCION HT3 Headspace Sampler together with the SCION Instruments 8300 GC platform in combination with to 8700 SQ-MS equipped with 8400PRO autosampler.
Beverages containing sodium or potassium benzoate in combination with ascorbic acid have the potential to form benzene. Headspace detection methods have been developed by numerous agencies, including the International Council of Beverages Associations and the US FDA.
A recent Tekmar application note indicated that using the HT3 with a modern mass spectrometer would yield parts per trillion detection levels of environmentally regulated compounds, including benzene, as low as 0.020 ppb in drinking water. The HT3 was paired with a GC/MS system equipped with turbo molecular pump, a Restek Rtx®-502.2 column, and Helium as the carrier gas. Parameters for these systems are listed in Table 1.
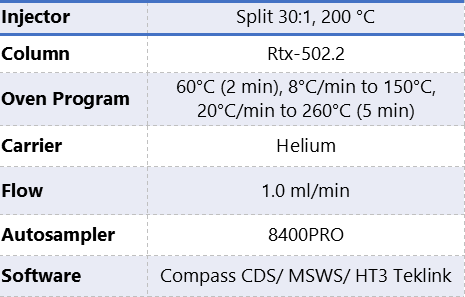
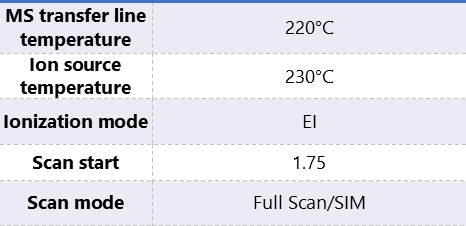
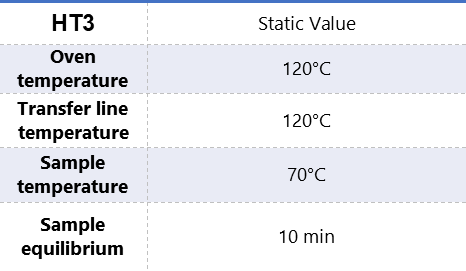
Table 1. Instrumentation operating conditions.
Standard Preparation
A benzene stock standard of 0.5 ppm in water and an internal standard of 4.2 ppb benzene-d6 in methanol were prepared following the FDA method. A standard curve from 0.050 ppb to 20 ppb was prepared by pipeting the 0.5 ppm standard into 10 g of reagent water in a 22 mL headspace vial containing internal standard. 10 µL of the benzene-d6 standard was added to all vials, instead of 25 µL per the FDA method.
Commercially available beverage samples with the potential to contain benzoate salts were selected. The selection included: four carbonated beverages, two energy/vitamin drinks and two nonalcoholic cocktail mixes. 10 g of each sample was weighed into a 22 mL headspace vial and 10 µL internal standard solution was added to each.
The use of sodium chloride, as well as a sodium hydroxide solution for carbonated beverages (suggested by the International Council of Beverages Association) was not tested in this application note.
Calibration Curves and Data
The standards and blanks were analyzed with the HT3 and GC/MS parameters listed in Table 1. Figure 2 compares the SIM chromatogram of the benzene 78 m/z quantitation mass of blank water and the 0.050 ppb standard, both with benzene-d6 internal standard. A lower concentration of benzene-d6 internal standard was used to minimize this mass 78 m/z interference of benzene. Figure 3 is a head to tail comparison of the reference spectra for benzene to benzene-d6 from the NIST 2.0 library.
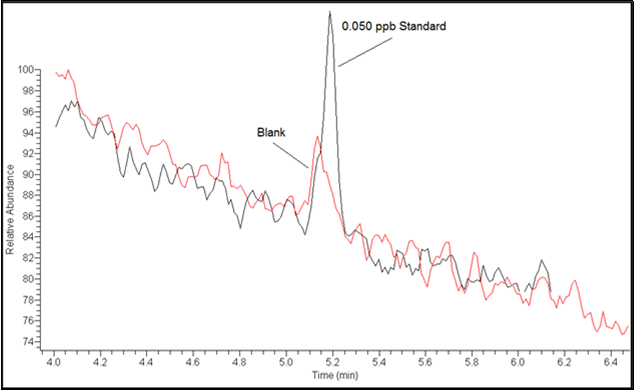
Figure 2. Comparison of the SIM Chromatogram Mass 78 m/z for Blank Water and the 0.050 ppb Standard, Both with Internal Standard.
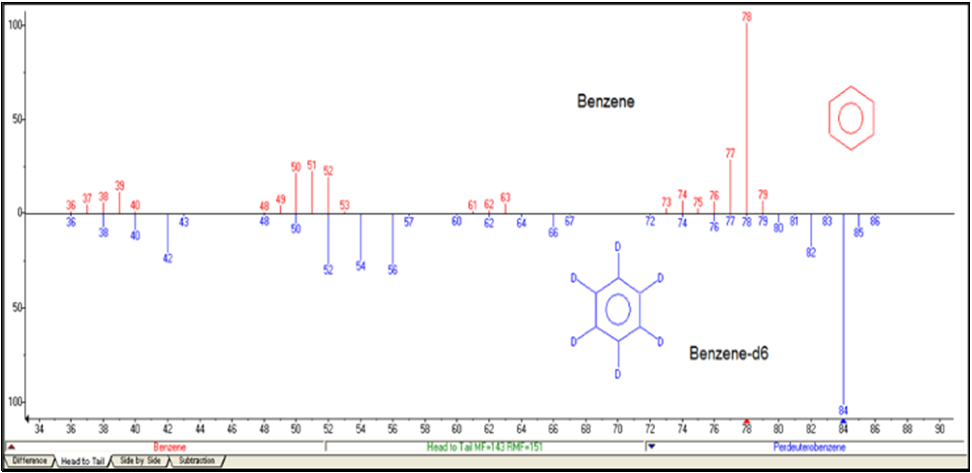
Figure 3. Head to Tail Comparison of Benzene to Benzene-d6.
Table 2 lists the response factor and linear calibration curve data for the 0.050 to 20 ppb benzene standards.
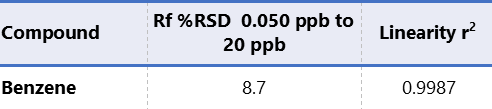
Table 2. Calculated data for benzene.
Beverage Preparation and Data
10 g of each beverage sample was transferred to 22 mL headspace vials and 10 µL of the benzene-d6 internal standard solution was added to each. The vials were sealed with crimp top caps with silicon septa, and the benzene concentration calculated. The results of the analysis are shown in Table 3.
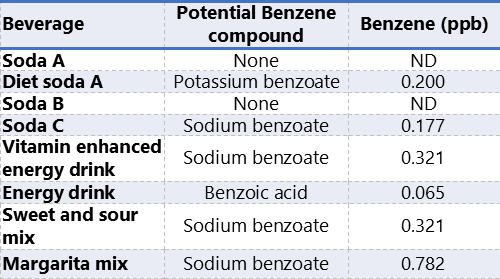
Table 3. Calculated benzene concentration for the sampled beverages and potential benzene forming compounds (determined by label content).
Additional Qualitative/Quantitative Information
Because the static headspace analysis was conducted with a GC/MS in SIM/scan mode, additional qualitative and quantitative information useful to a QC laboratory was obtained. Figures 3 and 4 show a comparison of the total ion chromatograms with observed additional peaks.
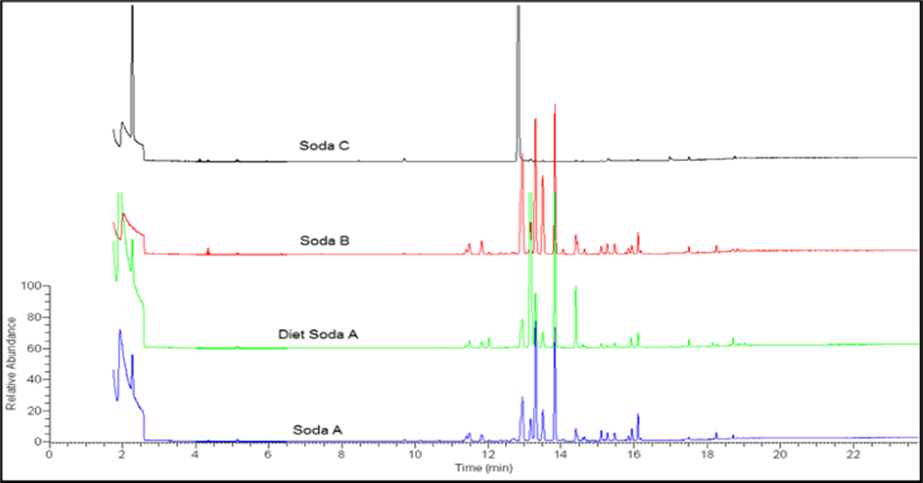
Figure 4. Overlay of the Total Ion Chromatogram for the Four Carbonated Beverages Indicating the Additional Peaks Observed with the Static Headspace Method.
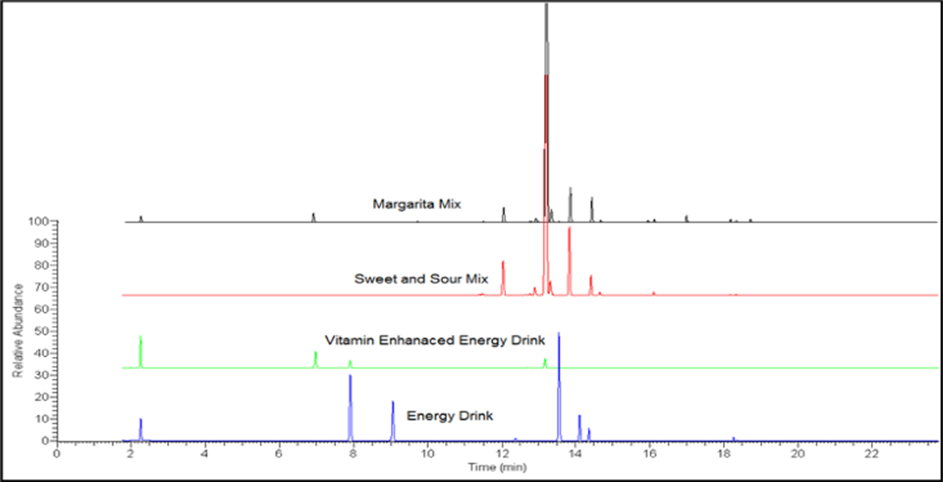
Figure 5. Overlay of the Total Ion Chromatogram for the Two Energy Beverages and Two Cocktail Mixes Indicating the Additional Peaks Observed with the Static Headspace Method.
Conclusion
The calibration curve data from 0.050 to 20 ppb was excellent. The ability to detect ppt levels of benzene with this instrument at the 0.05 ppb level greatly exceeds current benzene detection level requirements for drinking water (1 ppb for European communities and 5 ppb for the United States).
All eight beverage samples tested contained <1 ppb benzene. The energy drink sample was found to contain 0.065 ppb benzene, indicating the ability of the HT3 to deliver quantitative data well below the 0.5 ppb detection limit of current methods. Furthermore, the detection of additional volatile compounds observed in this static headspace method can greatly assist beverage laboratories in ensuring superior quality levels.
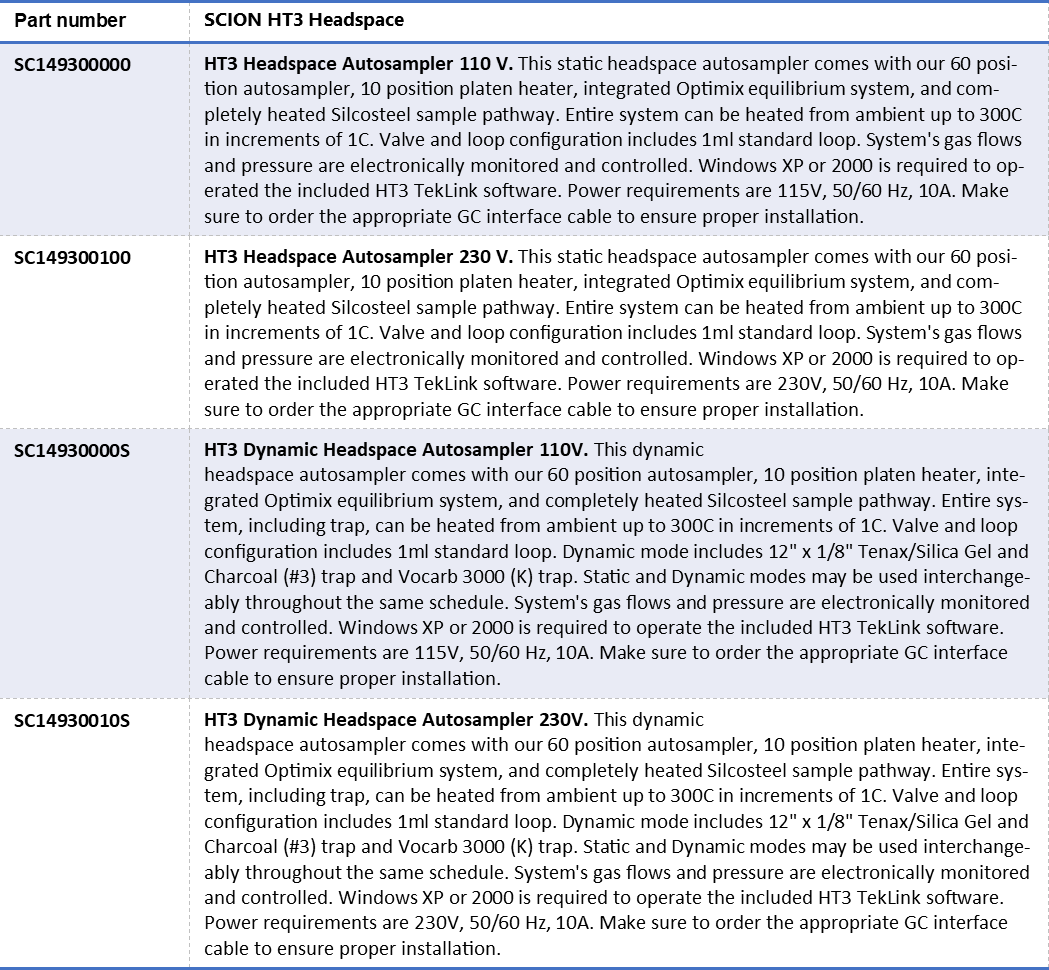
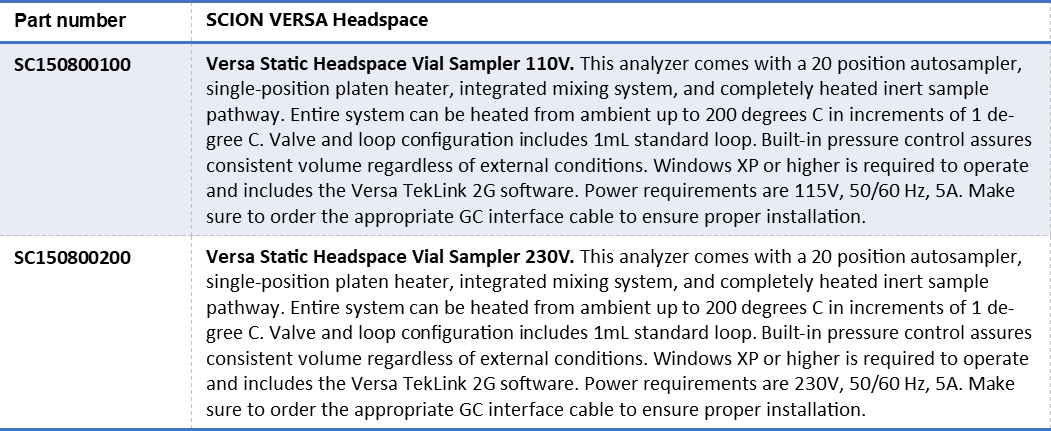
Order Information
Download Application Note
Download complete Application Note here: Achieving Low-Level Detection of Benzene in Beverages with an Automated Headspace Vial Sampler
Keep in Touch
If you wish to keep up to date with SCION Instruments latest research and articles, why not join us on social media and sign up to our Linkedin newsletters today?