Crude Oil Analysis - Combining Simulated Distillation (ASTM D7169) and Detailed Hydrocarbon Analysis (ASTM D7900) to Give a Full Boiling Point Distribution of Crude Oils.
Introduction
Physical distillation is still considered the reference method for distillation. Simulated distillation (simdist) by gas chromatography offers some significant advantages over the physical procedure, making this technique quite useful. Analysis by GC typically has the better precision, higher throughput, less hands-on time, and lower cost per sample. Also, Simdist requires considerably less sample to be run and can generally be considered the safer of the two techniques. Simdist is very suitable to characterize crude oils.
Knowledge of the boiling point distribution of stabilized crude oils is important for the marketing, scheduling, and processing of crude oil in the petroleum industry. ASTM methods D7900 and D7169 can be combined to determine the boiling point distribution of crude oils. For crudes with a significant light end this will be recommended.
Simdist method ASTM D7169 is widely used for determining the boiling point distribution of crude oils up to a final boiling point of 720°C. However, this method will give an incomplete result for the separation of C4-C9, due to the thin film column in the presence of large amounts carbon disulfide. This problem can be solved by combining the results of ASTM D7169 with results from another gas chromatograph (GC). A GC configured for ASTM D7900. This method will analyze the light end fraction of the crude oil, up to and including nonane. Results of both methods are merged into one boiling point distribution, which will give a more accurate data range of the crude oil.
High Temp SIMDIST ASTM D7169
ASTM D7169 determines the boiling point distribution of crude oils and residual samples up to a final boiling point of 720°C, this corresponds to the elution of n-C100. The method determines the boiling point distribution of samples from n-C9 up to n-C100.
This method can also be used to obtain the boiling point distribution of samples that do not fully elute, such as atmospheric and vacuum residues. The amount of residue (or sample recovery) is determined using an external standard. This provides insight into composition and allows for the determination of intrinsic product value.
A qualitative mixture of normal paraffins covering the range from C5 up to C100 is used to determine the relationship of boiling point (BP) versus retention times (RT). Reference oil 5010, which fully elutes from the column, is used to determine the detector response factor. CS2 blanks are run, and the resulting signal is subtracted from the response standard and the samples. Samples are injected and with the use of the response standard the recovery of the sample is calculated. A boiling point distribution can be calculated up to the recovered amount. Customized cut point reports can also be calculated.
Front-End DHA ASTM D7900
ASTM D7169 yields an unreliable boiling point distribution for the front-end fraction of a crude, therefor ASTM D7900 is used. This method determines the boiling point distribution of hydrocarbons in crude oil up to n-C9. Results of both methods are combined into one boiling point distribution.
An internal standard is quantitatively added to the crude oil. A small amount is injected onto a precolumn. When the front-end fraction (<C9) has reached the analytical column, the precolumn is backflushed to vent the higher boiling components.
The components are identified by comparison of reference chromatograms and the Eclipse database; the DHA/Simdist software. Eclipse can group individual components by hydrocarbon type. According to the composition of the frontend fraction the boiling point distribution will be calculated.
See table 1 for the analytical settings of both methods.
| ASTM D7169 | ASTM D7900 | |
| Injector | Cold-on-Column w. Air cooling | Split/Splitless Split 1:100 |
| Column | SCION-SIMDIST | Precolumn: SCION-1 Analytical column: SCION-DHA-100 |
| Oven | Start @ -20°C, 15°C/min to 430°C hold 10 min. |
Start @ 35°C, hold 30min. 2°C/min to 115°C, 10°C/min to 200°C, hold 5 min. |
| Carrier | Helium @ 20ml/min | Helium |
| Detector | HT FID, @ 435°C | FID, @ 300°C |
| Injection Volume | 0.5μl | 0.2μl |
| Software | Compass CDS w/ Eclipse SIMDIST | Compass CDS w/ Eclipse DHA |
Table 1: Analytical Conditions
Results High Temp SIMDIST ASTM D7169
Figure 1 shows a stable baseline and a CS2 injection free of any hydrocarbon interferences. Figures 2 and 3 show a chromatogram of the normal paraffins calibration standard and the chromatogram for reference oil 5010.
Reference oil 5010 was analyzed to verify that requirements of ASTM D7169 are met using this configuration. Table 2 clearly shows the analytical results obtained for this reference material passes criteria for acceptance.
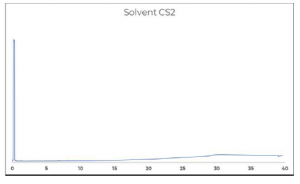 Figure 1: Chromatogram of solvent CS2
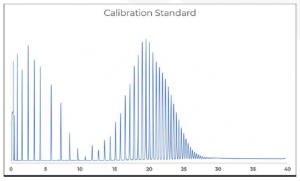
Figure 2: Chromatogram of D7169 calibration standard (C5-C100)
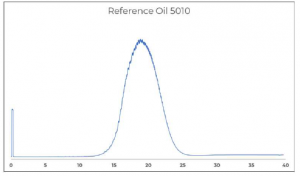 Figure 3: Chromatogram of reference oil 5010 in CS2
| % Off | CoA Result (°C) |
Allowable Difference (°C ) |
Result (°C) |
| IBP | 427,4 | 9 | 431,5 |
| 10 | 493,3 | 3 | 492,5 |
| 20 | 510,5 | 3 | 509,5 |
| 30 | 524,5 | 4 | 523,5 |
| 40 | 537,1 | 4 | 535,5 |
| 50 | 548,7 | 4 | 547,0 |
| 60 | 560,4 | 4 | 558,5 |
| 70 | 572 | 4 | 570,0 |
| 80 | 585,1 | 4 | 583,0 |
| 90 | 602,1 | 4 | 599,5 |
| FBP | 656,3 | 18 | 644,0 |
Table 2: Results, reference values and allowable difference for Reference oil 5010 in D7169
Results Front-End DHA ASTM D7900
A calibration mixture containing n-alkanes was used to calculate the Kovats indices of all components in the front-end fraction. The Kovats indices were compared with known indices in the database and peaks were assigned accordingly. Figure 4 shows a C5-C9 n-paraffin calibration standard. Based on this standard, the composition of the crude oil front-end can be identified and the boiling point distribution will be calculated.
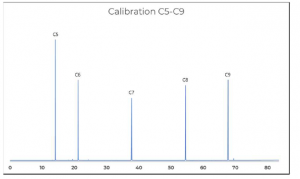
Figure 4: Chromatogram of calibration C5 – C9
Crude Oil Analysis Results
The front-end of the crude oil, with 1-hexene as internal standard, was injected onto the ASTM D7900 channel. Figure 5 shows the chromatogram of the front-end analysis.
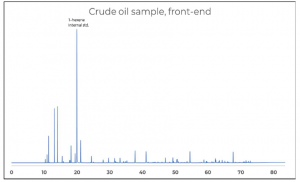
Figure 5. Chromatogram of crude oil, front-end
Table 3 shows the group report of the front-end fraction in mass (%). Based on the mass report and the internal standard, a boiling point distribution was made. Table 4 shows the boiling point distribution for the front-end fraction. This data will be merged with the data of ASTM D7169 into a total boiling point distribution of the crude oil. Table 5 shows the recovery in mass percentage at a boiling point of 151°C. This is the boiling point of n-nonane. Results until n-nonane are used in the merge with the data of ASTM D7169.
| N-Paraffins | i-Paraffins | Naphthene’s | Aromatics | Unknown | Total | |
| C3 | 0.13 | 0.00 | 0.00 | 0.00 | 0.00 | 0.13 |
| C4 | 1.03 | 0.30 | 0.00 | 0.00 | 0.00 | 1.32 |
| C5 | 2.67 | 2.41 | 0.15 | 0.00 | 0.02 | 5.25 |
| C6 | 1.65 | 2.00 | 1.11 | 0.28 | 0.00 | 5.03 |
| C7 | 1.24 | 1.26 | 1.63 | 0.44 | 0.00 | 4.56 |
| C8 | 0.99 | 1.41 | 0.93 | 0.76 | 0.17 | 4.27 |
| C9 | 0.87 | 0.68 | 0.39 | 0.00 | 0.09 | 2.03 |
| Heavy | 0.00 | 0.00 | 0.00 | 0.00 | 0.66 | 0.66 |
| Total | 8.56 | 8.05 | 4.23 | 1.47 | 0.94 | 23.3 |
Table 3. Group report in mass (%), crude oil front-end
| Percentage (mass) |
TPB (°C) |
Percentage (mass) |
TPB (°C) |
| IBP | -10.9 | 13.0 | 91.8 |
| 1.0 | -.4 | 14.0 | 94.0 |
| 2.0 | 6.3 | 15.0 | 98.8 |
| 3.0 | 17.9 | 16.0 | 104.6 |
| 4.0 | 28.2 | 17.0 | 114.6 |
| 5.0 | 31.3 | 18.0 | 118.9 |
| 6.0 | 34.4 | 19.0 | 124.0 |
| 7.0 | 58.1 | 20.0 | 136.1 |
| 8.0 | 60.2 | 21.0 | 138.9 |
| 9.0 | 64.5 | 22.0 | 146.7 |
| 10.0 | 67.6 | 23.0 | 165.0 |
| 11.0 | 73.7 | ||
| 12.0 | 89.1 |
Table 4. Boiling Point Distribution Report of front-end fraction
| Boiling Point (°C) | Recovery (mass %) |
| 151.0 | 22.6 |
Table 5. Recovery of front-end fraction at n-nonane boiling point.
The crude oil was injected onto the ASTM D7169 channel. Figure 6 shows the chromatogram of the crude oil. The data of this analysis is merged with the front-end data of ASTM D7900 into one rapport, for the complete boiling point distribution of crude oil. This boiling point distribution is showed in table 6. Table 7 shows the recovery of the crude oil at a temperature of 720°C. This is the boiling point of C100.
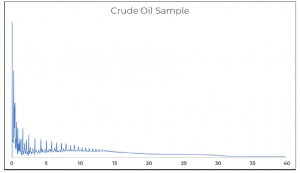
Figure 6: Chromatogram of crude oil
| Recovery (mass%) | TPB (°C) | Recovery (mass%) | TPB (°C) |
| IBP | -10.9 | 55.0 | 368.2 |
| 5.0 | 31.3 | 60.0 | 402.3 |
| 10.0 | 67.6 | 65.0 | 436.4 |
| 15.0 | 98.8 | 70.0 | 475.0 |
| 20.0 | 136.1 | 75.0 | 520.9 |
| 25.0 | 165.6 | 80.0 | 577.6 |
| 30.0 | 202.1 | 85.0 | 639.8 |
| 35.0 | 238.4 | 90.0 | 710.5 |
| 40.0 | 271.4 | 95.0 | NF |
| 45.0 | 303.2 | FBP | NF |
| 50.0 | 333.8 |
Table 6. Merged Boiling Point Distribution Report of crude oil.
| Boiling Point (°C) | Recovery (mass %) |
| 720.0 | 90.6 |
Table 7: Recovery of Crude Oil
Figure 7 shows the merged crude oil distribution report in Eclipse. The DHA curve is blue. The boiling point distribution until 151°C is based on the DHA ASTM D7900 data. The Simdist curve is black. The boiling point distribution is based on the simdist ASTM D7169 data from 151°C up to 720°C. The signal of the chromatogram of the simdist is corrected based on the merge with the DHA data.
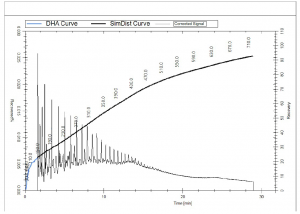
Figure 7. Merged distribution report in Eclipse
Conclusion
Simulated distillation can provide a very suitable alternative for conventional distillation methods. They typically provide a much more robust, economical, safe, automatable, and easy solution for obtaining accurate boiling point and cut point data for petroleum products, feedstocks and other petroleum fractions as specified in these different methods.
For crude oils with a significant light end it is advised to combine a High temp Simdist ASTM D7169 with a front-end DHA ASTM D7900. Due to large amounts of CS2 the simdist method will give an incomplete result for the separation of C4-C9. Front-end DHA ASTM D7900 will cover this analysis. Merging data from both methods will give a more accurate data range of crude oil. A complete boiling point distribution can be calculated. Customized cut point reports can also be made.
Scion Instruments can provide a High Temp Simdist ASTM D7169 and Front-end DHA ASTM D7900 combination with suitable software to get the best results for crude oil analysis.
Download the Application Note
Download the complete Application Note: Crude Oil Analysis – Combining Simulated Distillation (ASTM D7169) and Detailed Hydrocarbon Analysis (ASTM D7900) to give a Full Boiling Point Distribution of Crude Oils.
Keep in Touch
If you wish to speak to a member of our team about more information, please don’t hesitate to contact us. Or if you wish to keep up to date with SCION Instruments latest research and articles, why not join us on social media and sign up to our newsletters today?
