GC Columns - A Detailed Guide
A well-optimized chromatographic separation starts with the careful selection of the column. Four crucial factors – stationary phase, column inner diameter (I.D.), film thickness, and column length – guide the choice of the right capillary column for any application. These parameters are better shown in Figure 1, for a better understanding.
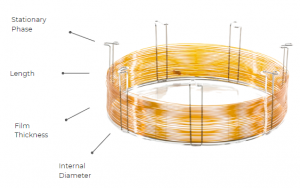
Figure 1. Scheme of the four key parameters of a GC column.
Nonetheless, the ultimate aim for every chromatographer is resolution, and its equation easily connects with the four key factors mentioned earlier and it can be easily visualized in Equation 1. Only by taking into consideration the resolution equation and these four essential factors can the appropriate column be effectively chosen. N, representing efficiency, is influenced by the column’s length, I.D., type of carrier gas and its velocity. K’, a metric for retention, is impacted by the I.D., film thickness, and temperature. Finally, α, indicating peak separation, is influenced by the stationary phase composition and temperature. This final parameter holds the most weight for the resolution.

Equation 1. Resolution formula, where N is the number of theoretical plates, k’ is retention factor and α is selectivity factor.
Before we explore the points mentioned earlier, it is important to note that there are two main types of GC columns: packed and capillary. Packed columns, the first in the history of GC systems, are made from materials like glass, stainless steel, copper, or aluminium, with internal diameters between 2-4 mm and length of 2-6 m. These columns are filled with a particulate solid support, featuring particle diameters ranging from 37-44 to 250-354 µm. With advancements in GC, capillary columns emerged. Unlike packed columns, capillary columns are crafted from fused silica and coated with a protective polymer layer. They have lengths ranging from 15-100 m and internal diameters between 150-300 µm. With the new parameters of the capillary columns, the chromatographic resolution increased.
1. Stationary Phase
Optimizing your GC separation begins with the crucial task of selecting the appropriate stationary phase, marking a pivotal decision in the process. This choice holds great importance, as it significantly influences α, the primary determinant of the resolution. The stationary phase’s polarity plays a decisive role in this regard.
The polarity of the stationary phase is ascertained by the nature and quantity of functional groups present. When contemplating a column selection, it becomes imperative to evaluate the polarities of both the stationary phase and the target analytes. Alignment of polarities enhances intermolecular forces, resulting in longer retention, and often leading to increased resolution. Consequently, the polarity of the stationary phase exerts a substantial impact on column selectivity and the separation factor, rendering it a critical consideration during column selection.
Stationary phase selectivity, defined by IUPAC, quantifies the degree of interference by other substances in determining a specific substance. This selectivity is intricately linked to the composition of the stationary phase and its interaction with target compounds through various intermolecular forces, such as hydrogen bonding, dispersion, dipole-dipole interactions.
As an example, by replacing methyl groups in the stationary phase with diverse functionalities like phenyl or cyanopropyl pendant groups, a shift occurs in the compound’s affinity with those specific functional groups (aromatics or polar compounds, respectively). This alteration leads to enhanced interactions and prolonged retention of compounds, often resulting in superior resolution and increased selectivity.
A simple rule that could be followed for column selection stands within the principle “likes dissolve like”. Non-polar compounds, consisting mainly of carbon and hydrogen atoms with C-C single bonds, are best analysed using non-polar capillary columns. The interaction between non-polar compounds and the phase is dispersive, driven by van der Waals forces, with larger compounds exhibiting longer retention based on their boiling points.

Figure 2.
On the other hand, polar compounds, encompassing additional elements like bromine, chlorine, fluorine, nitrogen, oxygen, phosphorous, or sulphur, find effective separation in intermediate polar or polar capillary columns. These interactions involve dispersive, pi-pi, and/or acid-base interactions, with separations determined by the overall effects of these interactions. Polarizable compounds, featuring double or triple C-C bonds, such as alkenes, alkynes, and aromatic hydrocarbons, are best suited for highly polar capillary columns.
Keep in mind that there are different types of capillary columns, depending on the stationary phase appearance. The most common one is Wall-Coated Open Tubular (WCOT), where the inner walls of the capillary tube are coated with the liquid stationary phase. Porous-Layer Open Tubular (PLOT) columns resemble the packed columns, as to the inner wall a porous solid support, such as alumina, silica gel, molecular sieves, etc., are bound to it. The last type, Support-Coated Open Tubular (SCOT) columns represent a mix between the PLOT and WCOT. It is basically a PLOT column where the porous solid support is coated with the liquid stationary phase. The figure below presents clearer how the 3 types of capillary columns differ from each other.
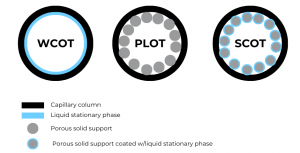
Figure 3. Scheme of the 3 different capillary columns
2. Column I.D.
Different capillary column internal diameters are currently available for commercial use, providing a delicate balance between two crucial factors: efficiency (measured by the number of theoretical plates, N) and sample capacity (the amount of a specific sample component that can be applied without overloading and compromising peak sharpness). Improving one of these factors often requires a compromise with the other. The ideal I.D. for a given application depends on specific analytical needs.
Notably, columns with a 0.25 mm I.D. offer sufficient plates per meter for most applications while maintaining an acceptable sample capacity. This compromise between efficiency and sample capacity makes the 0.25 mm I.D. the preferred choice for capillary GC columns. Columns with smaller or larger capacity depend on the unique requirements of their applications.
High efficiency is achieved through chromatographically narrow and well-resolved peaks and increases with a decrease in the column’s I.D. Therefore, when dealing with complex samples containing numerous analytes or closely eluting compounds, opting for the narrowest practical I.D. capillary column is advisable. Note that very narrow bore columns, like those with 0.10 or 0.18 mm I.D., may require specialized equipment, such as GC with a pressure regulator allowing higher column head pressure.
Sample capacity rises with an increase in column I.D. Wide bore columns can accommodate a greater mass of each analyte in a sample compared to narrow bore capillary columns. Exceeding a column’s sample capacity leads to distorted peaks and reduced resolution. Therefore, if samples contain compounds at high concentrations or encompass a broad concentration range, a wide bore column should be considered. Choosing the appropriate I.D. ensures the column can provide ample sensitivity for minor components without overloading on major components. Analysts must weigh the trade-off between efficiency and wide bore column use based on their application. Note that the nature of sample components and phase polarity influences sample capacity, with non-polar phases favoring non-polar analytes and polar phases favoring polar analytes.
Retention factor, k, is less impacted by column I.D. than by film thickness. However, when considering I.D. in conjunction with retention factor, a general rule prevails smaller I.D. columns yield higher retention factors compared to their larger ID counterparts. This phenomenon arises from the limited available volume of the carrier gas in the column. Smaller ID columns, generating higher k values, are particularly well-suited for analyzing complex samples containing a spectrum of low to high molecular weight compounds. It is essential to note that optimizing I.D. and film thickness together is crucial to achieve optimal resolution and peak shape.

Figure 4. Scheme regarding the optimum choice of the column I.D.
When determining the column I.D., the choice is influenced by the injection technique employed, such as split, splitless, direct, cool on-column injection, etc. For instance, 0.53 mm I.D. columns are well-suited for cool on-column injections as the syringe needle (26 gauge) fits into the larger column I.D. Additionally, consideration must be given to the detector and its optimal flow rate. Some MS detectors operate effectively only under flow rates of up to 1.5 mL/min. Consequently, a 0.53 mm I.D. column, which required higher flows for proper chromatography, is not suitable for MS applications.
3. Film thickness
Most 0.25 mm I.D. columns come with a 0.25 and 0.50 µm film thickness, and the optimal film thickness depends on the specific applications. In the case of decreasing film thickness, the performance shows sharper peaks (potentially enhancing resolution), reduced column bleed, and an elevated maximum operating temperature. However, drawbacks include heightened analyte interaction with tubing walls and decreased analyte capacity. Thinner film columns facilitate shorter retention times and lower elution temperatures, which may be advantageous or disadvantageous based on the application. They are recommended for analytes with high boiling points (>300 degrees Celsius) or for trace analyses of substances like pesticides, PCBs, FAMEs, and other semivolatile compounds.
On the other hand, increasing the film thickness diminishes analyte-tubbing interaction and increases sample capacity. However, drawbacks include broader peaks (potentially reducing resolution), heightened column bleed, and a reduced maximum operating temperature. Increased film thickness leads to extended analyte retention and elution temperatures, which may be either beneficial or undesirable depending on the application. Thicker film columns are suitable for analytes with low boiling points (e.g. volatile organic compounds and gases), providing longer retention and increased capacity for higher concentration samples compared to thinner film columns.
The impact of film thickness is interconnected with column I.D. The phase ratio, represented by beta (β), defines the ratio of gas volume to stationary phase volume in a column using the formula below.

Equation 2. Phase ratio equation used to easily determine the required film thickness and column I.D.
Β values establish a distinct ranking for columns. As a guideline, column selection based on β values can be approached as follows:
| β Value | Uses |
| <100 | Highly volatile, low molecular weight compounds |
| 100–400 | General purpose analyses Wide range of compounds |
| >400 | High molecular weight compounds Trace analyses |
Β values proves to be valuable when altering combinations of I.D. and film thickness for a specific analysis. Columns with identical phase ratios will yield closely similar retention time and elution orders under consistent analytical conditions.
The film thickness directly influences both the retention of individual sample components and the maximum operating temperature of the column. When dealing with highly volatile compounds, opting for a thick film column enhances retention, as the compounds spend more time in the stationary phase, leading to increased separation. Conversely, for high molecular weight compounds, a thinner film column is preferable, reducing analyte time in the column and minimizing phase bleed at higher elution temperatures. Consult Figure 5 to select the optimal film thickness for your application. Keep in mind that, as a general guideline, thicker films correlate with lower maximum temperatures, and exceeding this limit may result in column bleed and should be avoided.
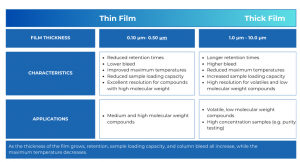
Figure 4. Film thickness description.
4. Carrier Gas Type and Linear Velocity
Carrier gas choice and linear velocity profoundly impact column separation efficiency, as evident in van Deemter plot (Figure 5). The optimum linear velocity, minimizing H and maximizing efficiency, varies among common carrier gases.
Nitrogen provides optimal efficiency but exhibits a steep van Deemter curve, making small velocity changes result in significant efficiency fluctuations. Helium offers a wide range for optimal linear velocity but slightly lower efficiency. Despite this, helium’s faster optimum velocity results in approximately half the analysis time compared to nitrogen, with only a minor sacrifice in efficiency for velocity variations. Hydrogen has the flattest van Deemter curve, leading to the shortest analysis times and a broad range of efficient average linear velocities.
For constant pressure work, the carrier gas head pressure remains steady during column temperature programming, while average linear velocity decreases. Electronic pneumatic control (EPC) allows for constant flow or linear velocity, sustaining high efficiency in temperature-programmed runs.
Considering carrier gas type, helium is preferred for MS as a vacuum-outlet detector in GC due to its efficiency and easier pumpability than hydrogen. Hydrogen’s reactivity in MS sources can lead to undesirable spectrum changes. Nitrogen is generally unsuitable for GC-MS as it significantly reduces sensitivity.
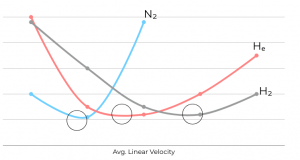
Figure 5. Operating carrier gas at the optimum linear velocity will maximize efficiency at a given temperature. Black circles indicate optimum linear velocities for each carrier gas.
We have included instances of column selection from our laboratories as well. A comparative analysis was conducted for residual solvents, specifically examining SCION-1 and SCION-624. The key distinction between the columns lies in the stationary phase, SCION-624 possesses greater polarity by comparison. The solvents tested in this comparison included methanol, ethanol, acetone, and toluene, all exhibiting intermediate polarity due to the presence of hydroxyl group for methanol and ethanol, carbonyl ketone group for acetone or an aromatic ring for toluene.
In the case of SCION-1, limited interactions occur within the column, resulting in the early and too close elution of the compounds. For instance, Figure 6 illustrates the outcome of SCION-1 test, where ethanol partially coelutes with the solvent acetonitrile, and acetone elutes simultaneously with the solvent, therefore not being able to properly identify the peak. Conversely, in the analysis using SCION-624, all residual solvents are present, and baseline separated, as shown in Figure 7. With a more polar column, the compounds can engage in diverse interactions with the bonded phase within the inner tube of the column.
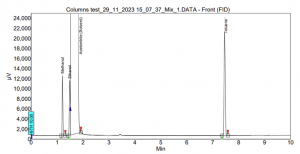
Figure 6. Residual solvents analysis using SCION-1.
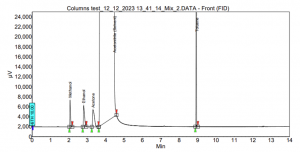
Figure 7. Residual solvents analysis using SCION-624MS.
Furthermore, our laboratory addressed the longstanding challenge of separating Xylenes isomers and Ethylbenzene. The mixture underwent testing on both SCION-1 and SCION-WAX columns. On SCION-1, an unavoidable coelution between Ethylbenzene and one of the Xylenes isomers was observed. Additionally, the peaks of M-xylene and the combination of Ethylbenzene with P-xylene were in proximity, leading to reduced selectivity. These intricacies are clearly illustrated in Figure 8.
By transitioning to a SCION-WAX column, baseline separation of the peaks was achieved, as shown in Figure 9. Although O-xylene is slightly close to the solvent peak, this is not a significant issue, and it can be easily addressed with a different oven program.
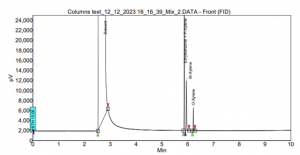
Figure 8. Xylenes and Ethylbenzene analysis using SCION-1.
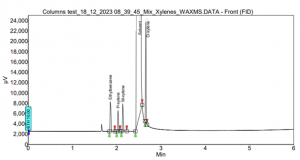
Figure 9. Xylenes and Ethylbenzene analysis using SCION-624MS.
These two examples from our laboratories highlight the critical significance of selecting the appropriate stationary phase for compound separation. This choice holds paramount importance as it directly influences selectivity, which serves as the primary factor in determining resolution. While the column’s I.D. and film thickness also play a role, their impact is not as pronounced, and the decision-making process for their selection is comparatively more straightforward, and it is highly recommended to consider these factors in tandem.
Chromatographic Columns From SCION
Explore SCION Instruments range of chromatographic columns. For more information or any queries regarding columns, please get in touch, and a member of our team will be happy to help.
